Customer Profiling with Descriptive Analytics with SQL (1st step of Customer Analytics)
Customer Relation Management classroom project
(1) Data source from Dunnhumby (Image by Dunnhumby)
If you are interested in articles related to my experience, please feel free to contact me: linkedin.com/in/nattapong-thanngam
This article is part of a series about Customer Analytics_._ (Part 1: Customer Profiling with Descriptive Analytics with SQL),(Part 2: Customer Segmentation with Clustering), (Part 3: Market Basket Analysis), and (Part 4: Product Recommendation)
Customer profiling is a way of creating portraits of your customers that are based on factual information, such as their buying behaviors or customer service interactions. Because the data is quite big, descriptive analysis (Mean, Median, Mode, Standard Deviation, etc.) will help us understand overview of our customers.
Note:
- Data set from Dunnhumby_Carbo-Loading
- Use Google BigQuery and SQL
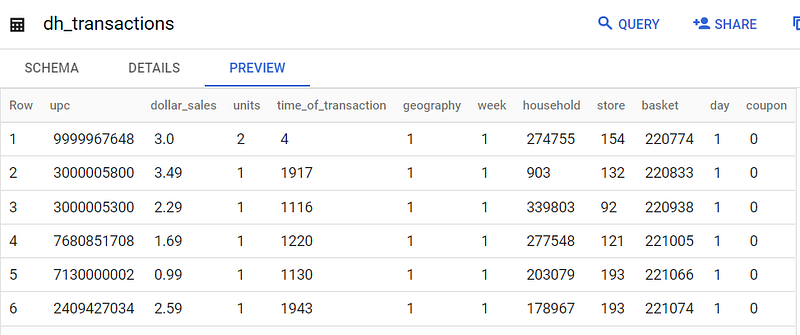
(2) Data Preview: dh_transactions (Image by Author)
Dataset details:
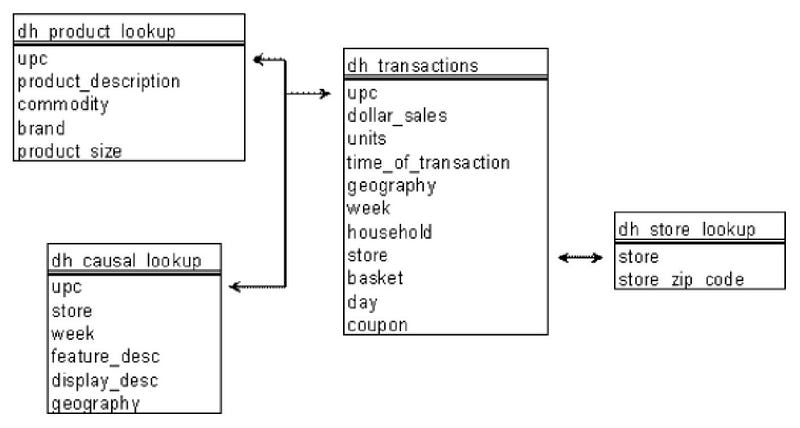
(3) Schema diagram (Image by Dunnhumby)
- 5,197,681 Transactions
- 927 Universal Product Codes
- 387 Stores
- Period = 728 days
- 4 Product categories (Pasta, Pasta Sauce, Pancake Mix, Syrup)
How to start “Customer Analytics”:
- Sometime, after we get data, we do not know about to start working.
- I recommend to start by using RFM Framework. You will understand your customer about Last visit (R), Total visit (F), Total Spend (M)
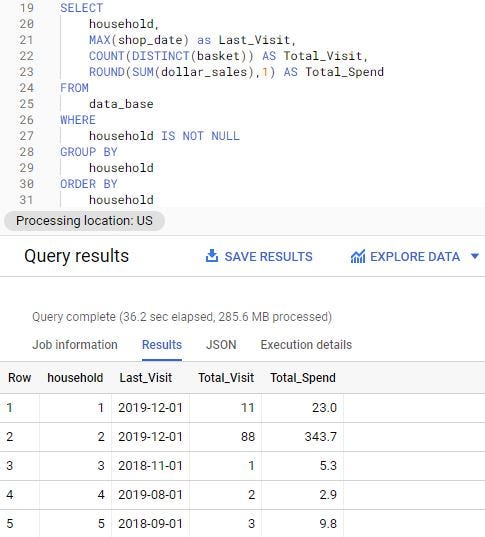
(4) Customer analytic base on RFM (Image by Author)
- This framework will show you about overview of customer profiling.
- We will know who is regular customer that we should take care more than others.
- We can use this result to do Customer Segmentation with Clustering (It will show in next article)
- We can do visualization to overview customer behavior such as histogram plot, Box plot, scatter plot, …to show max, min, mean, variance of visiting spending.
More detail of Customer Single View:
- We can add First_Visit, Total_Unit, AVG_Weekly_Visit, AVG_Weekly_Spend and AVG_Basket_size
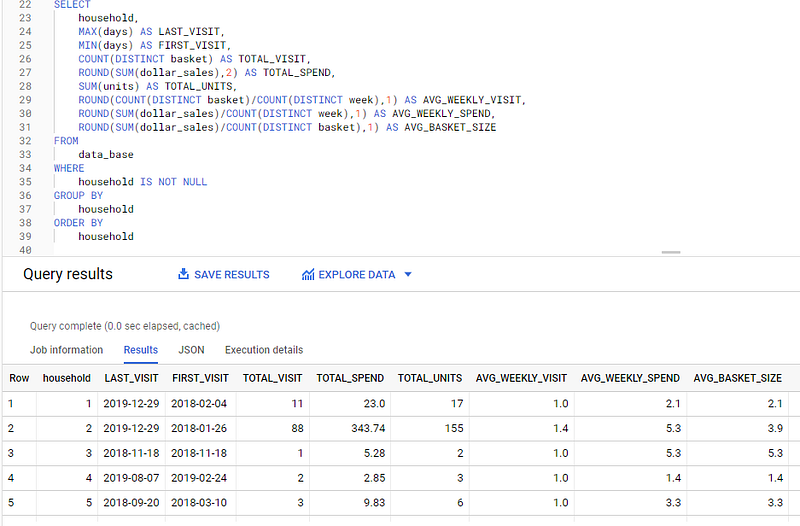
(4) Add AVG_Weekly_Visit, AVG_Weekly_Spend, AVG_Basket_size, etc. (Image by Author)
- For more analysis detail, we can add history spending to show momentum of each customer who spend more/less base on previous spending. It need to use function “LAG()” in SQL.
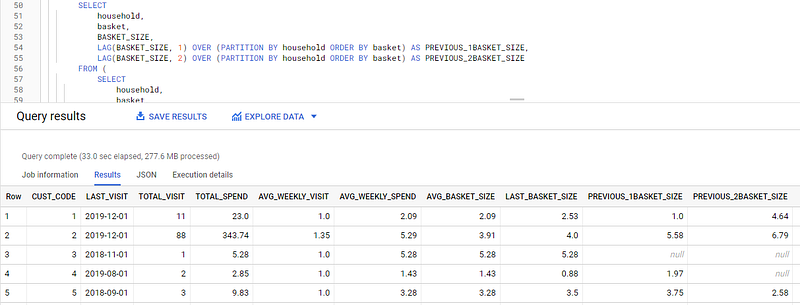
(5) Add previous basket size (Image by Author)
- For example, customer_code number 2 has continuous spending decreasing (6.79 → 5.58 → 4.00). If we know about it, we can take action to keep customer.
- Another way to monitor customer behavior, we can add history GAP of visiting to show momentum of each customer.
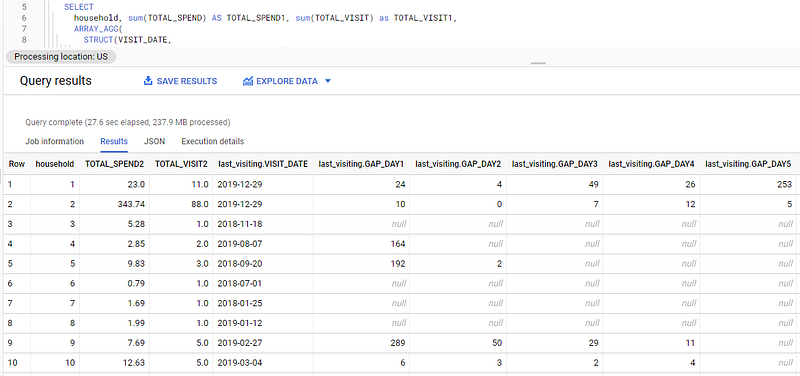
(6) Add GAP of visiting (Image by Author)
- For example, customer_code number 9 has GAP of visiting increasing (11 day → 29 day → 50 day → 289 day). If we know about it, we can take action to protect customer loss.
- Pivot is other tool to use for customer behavior monitoring.
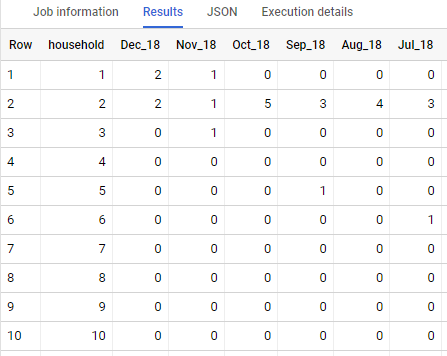
(7) SQL pivot for count visiting/month (Image by Author)
Note:
- Other types of dashboards such as monthly dashboard, churn dashboard, sale dashboard will show in the next article.
- Customer analysis also can use Python code. Teacher wants me to practice other tools. Moreover, a lot of information in this article comes from my teacher.😅😄🤭
Next Step
- After we know customer profiling (Part 1), we will do Customer Segmentation with Clustering (Part 2)
Please feel free to contact me, I am willing to share and exchange on topics related to Data Science and Supply Chain.
Facebook: facebook.com/nattapong.thanngam
Linkedin: linkedin.com/in/nattapong-thanngam
Originally published on Medium
Related

A Practical Guide to Building Agents
คู่มือปฏิบัติ: การสร้าง Agent ด้วย LLM โดย OpenAI

AI in the Enterprise โดย OpenAI
ถอดรหัสเคล็ดลับองค์กรระดับโลก ปลดล็อกศักยภาพ AI สร้างความได้เปรียบทางธุรกิจ
Best Practices for Bar Charts
Visualization Series — Episode 2

Best Practices for Line Charts
Visualization Series — Episode 3