Customer Segmentation with Clustering (2nd step of Customer Analytics)
Customer Relation Management classroom project
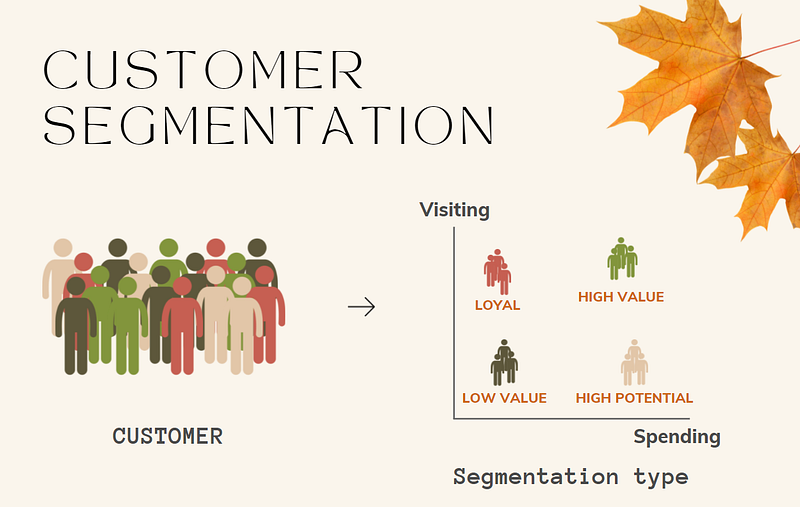
(1) Customer Segmentation (Image by Author)
If you are interested in articles related to my experience, please feel free to contact me: linkedin.com/in/nattapong-thanngam
This article is part of a series about Customer Analytics_._ (Part 1: Customer Profiling with Descriptive Analytics with SQL),(Part 2: Customer Segmentation with Clustering), (Part 3: Market Basket Analysis), and (Part 4: Product Recommendation)
Customer segmentation is the practice of dividing a company’s customers into groups that reflect similarities among customers in each group. The goal of segmenting customers is to decide how to relate to customers in each segment in order to maximize the value of each customer to the business. The basic types of market segmentation are 1. who they are (Age, Geography, Income, Relationship status, Job type, …) 2. what they do (Basket size, Visiting rate, Tenure (how long they stay with you), …).
Note:
- Data set from Dunnhumby_Carbo-Loading
- Use Python with K-mean clustering
In the last articles, RFM Framework is used to create customer profiling that consists of Total visit (F) and Total Spend (M). Moreover, Carbo-loading data do not have other customer information. Therefore, this article will use total visiting and total spending to create customer segmentation.
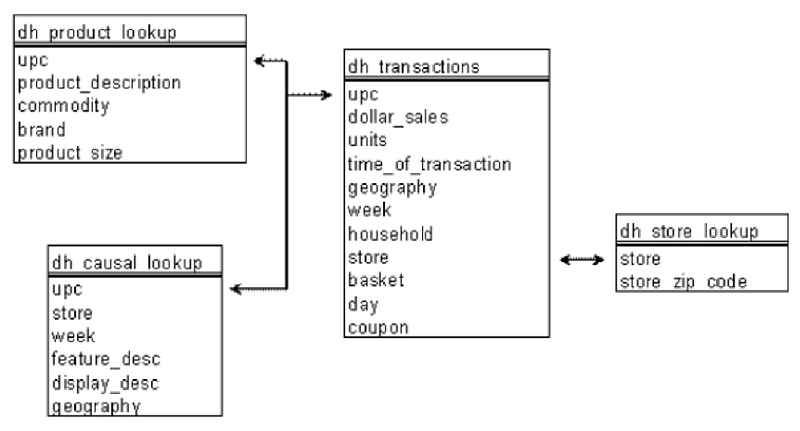
(2) Schema diagram (Image by Dunnhumby)
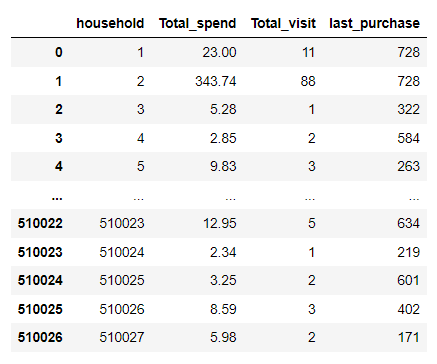
(3) Data after join and aggregation (Image by Author)
- After joining and aggregation, I recommend creating basis visualization to overview data profiling (Box plot, Scatter plot).
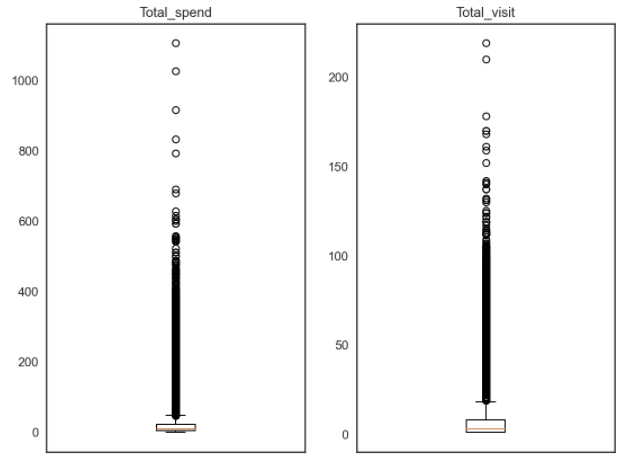
(4) Box plot for Total spending and Total visiting (Image by Author)
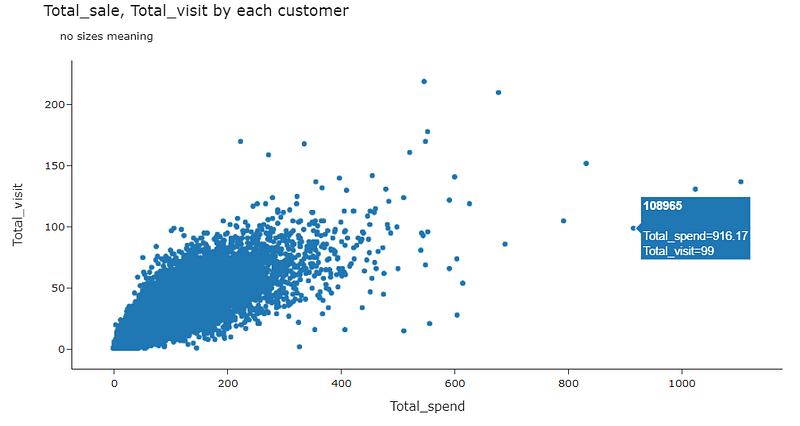
(5) Scatter plot for Total spending and Total visiting (Image by Author)
- To Start Customer Segmentation, this article will use K-Mean method that step of algorithm consists of
- Choose your value of K
- Randomly select K data points to represent the cluster centroids
- Assign all other data points to its nearest cluster centroids
- Reposition the cluster centroid until it is the average of the points in the cluster
- Repeat steps 3 & 4 until there are no changes in each cluster
- Moreover, we should use “for loop” to vary K-number (Number of centroids). Easier to imagine customer profiling after segmentation. The following figure varies K-number from 1 to 9.
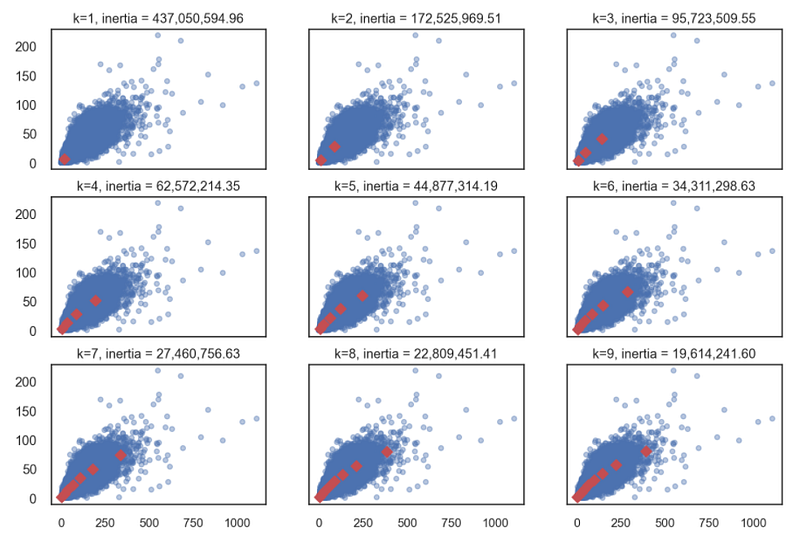
(6) Vary K-number (Image by Author)
- To select proper K-number, Elbow method (and/or silhouette method) is used for K-number selection.
The Elbow Method is one of the most popular methods to determine this optimal value of k. Concept of elbow method:
- Varying the number of clusters ( K )
- For each value of K, algorithm will calculate WCSS ( Within-Cluster Sum of Square ) which means “the sum of squared distance between each point and the centroid in a cluster”.
- Plot the WCSS with the K value, the plot looks like an Elbow
- WCSS value is largest when K = 1 and the number of clusters increases, the WCSS value will start to decrease.
- We would choose a value of k where the SSE begins to flatten out and we see an inflection point.
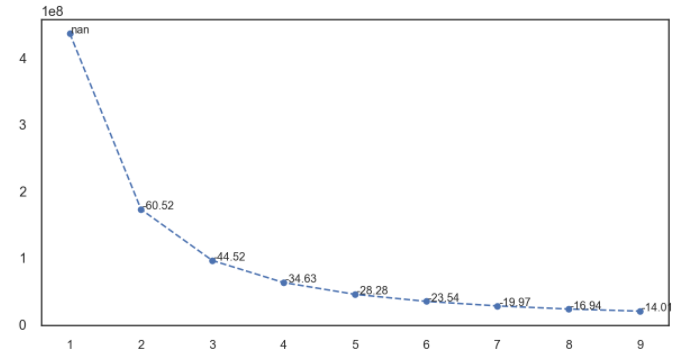
(7) Elbow method curve with percentage of distance reduction (Image by Author)
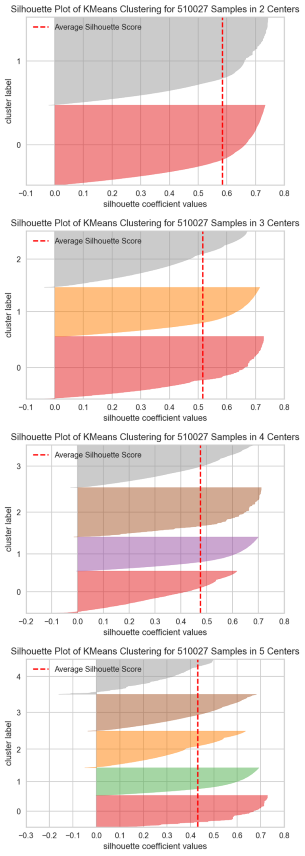
(8) Silhouette plot (Image by Author)
- Select K-number = 3. (Elbow curve start flatten and Silhouette plot has high value)
- After that, we should create data visualization again. It can help us understand the information in each segment.
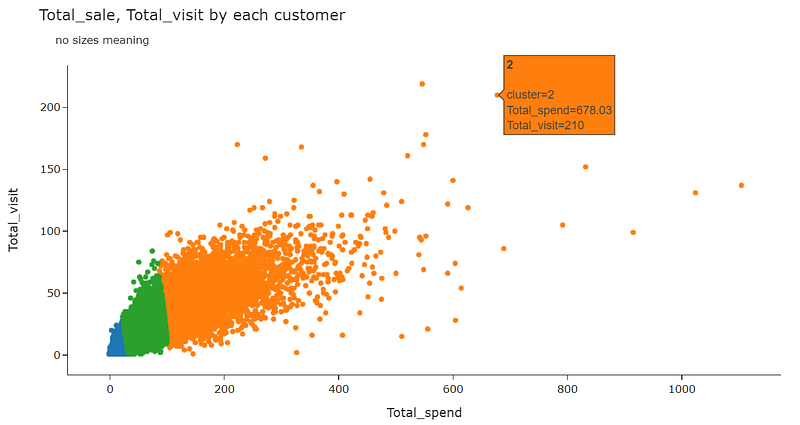
(8) Scatter plot after segmentation (Image by Author)
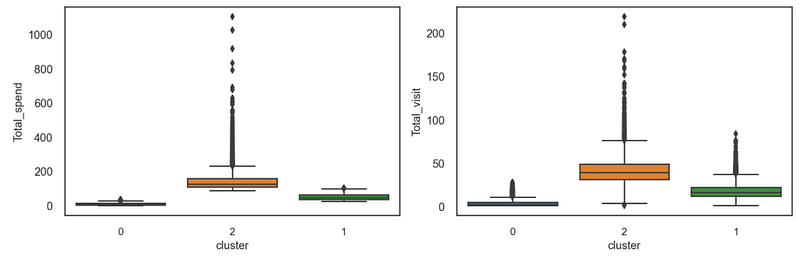
(9) Box plot to show total spending and total visiting in each segment (Image by Author)
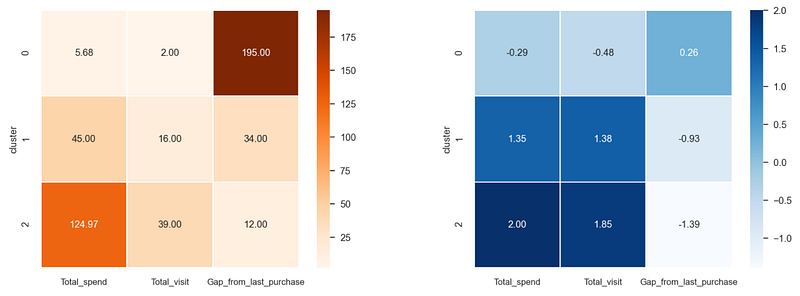
(10) Heat map to show the mean value of each segment (Orange: data before normalization, Blue: data after normalization) (Image by Author)
- After segmentation, we should set the name of each group such as “Silver, Gold, Platinum”. Easier for calling in next article.
- Moreover, we can apply machine learning “Decision tree” to find
- Tree diagram for class splitting (only guideline)
- Feature importance for class splitting.
A Decision Tree is a supervised Machine learning algorithm. It is used in both classification and regression algorithms. The decision tree is like a tree with nodes. The branches depend on a number of factors. It splits data into branches like these till it achieves a threshold value. A decision tree consists of the root nodes (top nodes, decision tree starts), children nodes (decision node, inner node), and leaf nodes (final output node).
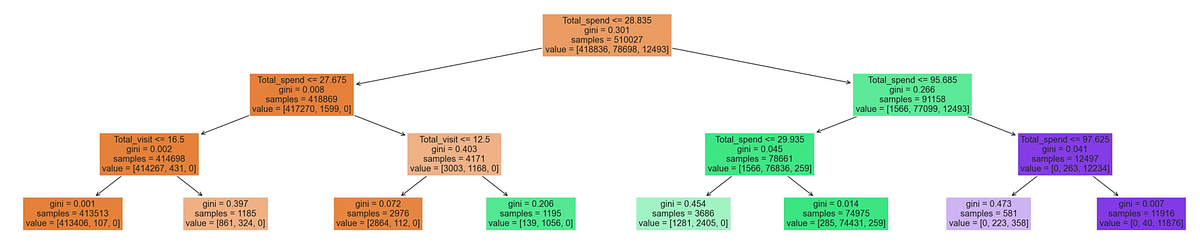
(11) Tree diagram for class splitting. Limit only 3 depth (Image by Author)
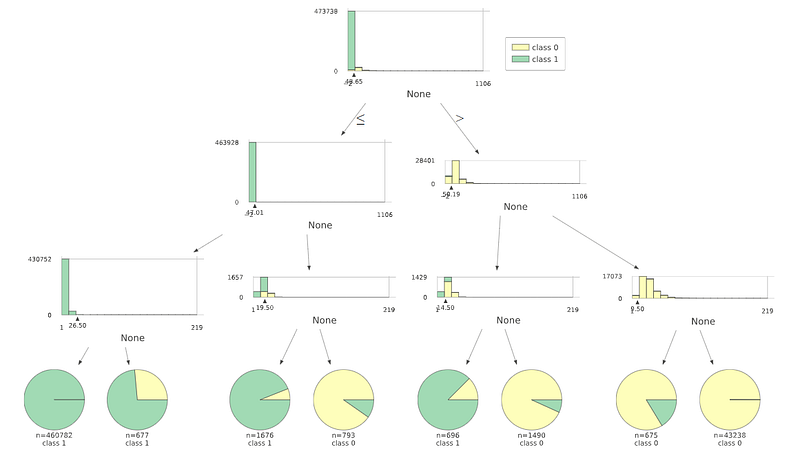
(12) Tree diagram with graphviz (Image by Author)
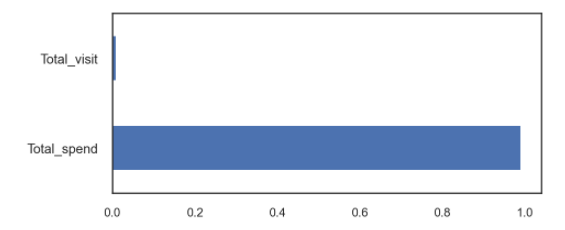
(13) Feature importance after run decision tree (Image by Author)
Highlight Benefits of Market Segmentation
- More effective marketing: By better recognizing the needs of your customers, you can identify more effective tactics for reaching them and improving their interactions and experience with your business.
- Higher quality leads: You’ll also notice that the more targeted more marketing is, the better your leads become. You’re reaching the right people, and they’re starting to notice you!
- Improved customer retention: By identifying your customers by their needs, you can put out marketing that offers irresistible reasons for a return visit. This is proven to increase customer retention, customer loyalty, and lifetime value.
Note
- This is only for Python coding practice with big data so I used 2 years data
- Actually, I think no need to run the analysis base on 2 years’ data. It should analysis based on routine monitoring (1 week, 2 weeks, 1 month)
Next Step
- After customer segmentation with clustering, we will do Market Basket Analysis (Part 3)
Please feel free to contact me, I am willing to share and exchange on topics related to Data Science and Supply Chain.
Facebook: facebook.com/nattapong.thanngam
Linkedin: linkedin.com/in/nattapong-thanngam
Originally published on Medium
Related
A Guide to Sampling Techniques: CRISP-DM Data Preparation
Data Mastery Series — Episode 7: Data Sampling

Adaptive RAG
Data Mastery Series — Episode 52: ปรับ RAG ให้ “รู้จักประเมินสถานการณ์” ก่อนลงมือค้นข้อมูล

Agentic RAG
Data Mastery Series — Episode 51: เปลี่ยน RAG ให้ “คิด” ได้
CRISP-DM: Business Understanding as the Foundation of Data Mining
Data Mastery Series — Episode 2: Busines Understanding