รีวิว DevSecOps Transformation & Technologies — Skooldio (Part 2/3)
พัฒนา Software อย่างมีประสิทธิภาพ ด้วย DevSecOps
Connect with me and follow our journey: Linkedin, Facebook
ใน Part 1 เราได้เรียนรู้เกี่ยวกับ ภาพรวมของ DevSecOps, VCS, CI/CD และ Artifacts ซึ่งเป็นส่วนที่เน้นไปที่ฝั่ง Developer หากยังไม่ได้อ่านแนะนำให้กลับไปอ่านก่อนนะครับ:
- Part 1: VSC, CI/CD และ Artifacts
ใน Part 2 นี้ เราจะโฟกัสที่ Infrastructure (Cloud, Containers, Docker, Kubernetes), Monitoring และ Automation Security ซึ่งเป็นส่วนที่เกี่ยวข้องกับ Operation และ Security
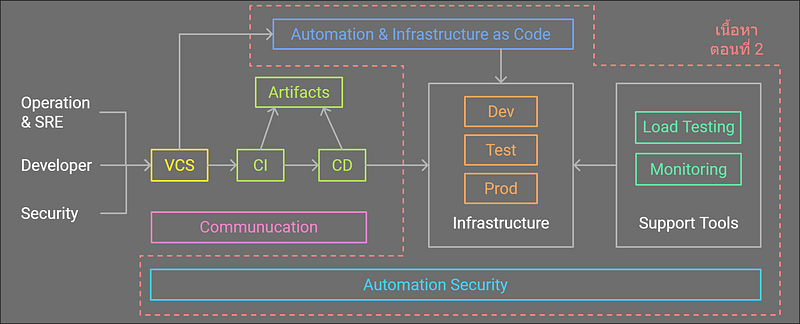
Figure: สรุปภาพรวมเนื้อหาในส่วนที่ 2 (Image by Author)
3. Infrastructure
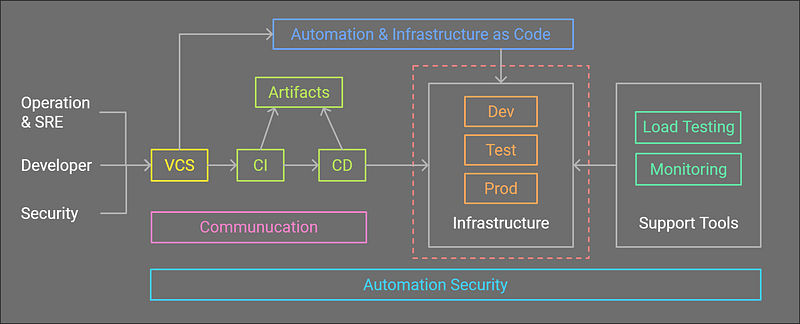
Figure: Infrastructure: Cloud, Container, Docker, Kubernetes (Image by Author)
Modern Infrastructure
ปัจจุบัน Infrastructure ถูกออกแบบให้รองรับการพัฒนาซอฟต์แวร์ที่มีการ Scale อย่างรวดเร็วและ Dynamic ซึ่งทีม Dev และ Ops ควรรู้จักแนวคิดเหล่านี้:
- Cloud Computing: รองรับการ Scale ระบบแบบ Dynamic
- Container & Docker: ช่วยสร้าง Environment ที่คงที่และแชร์ได้
- Kubernetes: ระบบจัดการและ Orchestrate Containers สำหรับระบบขนาดใหญ่
ประเภทของ Cloud: Private, Public, Hybrid และ Multi-Cloud
- Private Cloud: องค์กรสร้างและดูแลโครงสร้างพื้นฐานเองทั้งหมด (Hardware & Software) ตัวอย่าง: VMWare, Nutanix, OpenStack
- Public Cloud: ผู้ให้บริการ Cloud จัดเตรียม Infrastructure พร้อมใช้งานตัวอย่าง: AWS, Azure, Google Cloud, Alibaba Cloud
- Hybrid Cloud: ผสานระหว่าง Private Cloud และ Public Cloud ตัวอย่าง: AWS Outposts, Google Anthos, Azure Stack
- Multi-Cloud: ใช้ Cloud หลายเจ้าเพื่อเพิ่มความยืดหยุ่นและลดความเสี่ยง
- Hybrid Cloud และ Multi-Cloud เป็นที่นิยมในองค์กรขนาดใหญ่
- Cloud มีคุณสมบัติที่สอดคล้องกับ DevSecOps Core Values ได้แก่:
- On-demand Self-service: Dev สามารถสร้างหรือปรับเปลี่ยน Environment ได้เองภายใต้ข้อจำกัดที่กำหนด
- Rapid Elasticity and Scalability: รองรับการขยายระบบอย่างรวดเร็ว
Cloud Service Models
- Private Cloud: ลูกค้าต้องดูแลโครงสร้างพื้นฐานเองทั้งหมด เช่น จัดการเซิร์ฟเวอร์, การเดินสาย, การจัดการ OS
- Infrastructure as a Service (IaaS): ผู้ให้บริการดูแล Physical Infrastructure (Networking, Storage, Servers) ลูกค้าจัดการเฉพาะ OS และ Application เช่น AWS EC2, Google Compute Engine
- Platform as a Service (PaaS): o ผู้ให้บริการดูแล OS และ Infrastructure ให้ทั้งหมด ลูกค้าเพียงจัดการโค้ดและการ Deploy เช่น Kubernetes, Google App Engine
- Software as a Service (SaaS): ลูกค้าใช้งาน Software โดยไม่ต้องดูแลอะไรเลย เช่น Office 365, Gmail, Zoom
PaaS, Serverless และ BaaS
- PaaS (Platform as a Service): ให้บริการ Platform สำหรับ Deploy โค้ด เช่น Kubernetes, Google App Engine ข้อเสีย: คิดค่าใช้จ่ายตลอดเวลา แม้ไม่มีผู้ใช้งาน
- Serverless: พัฒนาแนวคิด PaaS โดยคิดค่าใช้จ่ายเฉพาะเมื่อมีการใช้งาน เช่น AWS Lambda, Cloud Run, Google Cloud Function ข้อเสีย: มีปัญหา Cold Start (เริ่มทำงานช้าในช่วงไม่มีการใช้งานนาน)
- BaaS (Backend as a Service): ให้บริการ Backend สำเร็จรูป เช่น Database, Authentication เช่น Firebase
Containers, Docker และ Kubernetes
- Virtual Machine (VM) vs Docker Container
- VM: ระบบเสมือนที่จำลองทั้ง OS และฮาร์ดแวร์ ทำงานแยกจากกัน
- Docker Container: ระบบเสมือนน้ำหนักเบาที่รันเฉพาะแอปพลิเคชันและไลบรารีที่จำเป็น บน OS หลักเดียวกัน
- ทั้ง VM และ Container จะต้องใช้ด้วยกัน ไม่มีใครมาทดแทนใคร เพราะ Container ยังจัดการ Resource ไม่ดีในเครื่องขนาดใหญ่
- ทั้ง VM และ Container ควรถูกใช้ร่วมกัน เพราะแต่ละเครื่องมือมีจุดแข็งที่ต่างกัน
- อย่าใช้ Container สำหรับ Production Database ให้จัดการใน VM จะดีกว่า
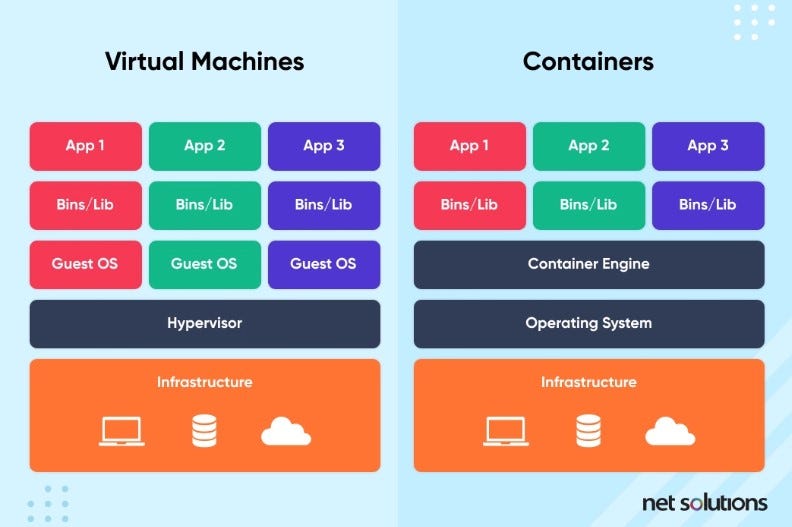
Figure: VM vs Container from https://www.netsolutions.com/insights/containerization-vs-virtualization/
- Container:
Container เป็นการแยกทรัพยากรสำหรับรันแอปพลิเคชันอย่างมีประสิทธิภาพ ลดปัญหา “มันรันบนเครื่องฉันได้ แต่บน Production ไม่รัน” - Docker: Build → Ship → Run
Docker คือซอฟต์แวร์ที่ทำให้การใช้งาน Container ง่ายขึ้น มี Workflow หลัก:
- Build: สร้าง Docker Image ผ่าน Dockerfile (ชุดคำสั่งในการสร้าง Docker Image)
- Ship: ส่ง Docker Image ไปยัง Docker Registry เช่น Docker Hub
- Run: รัน Docker Image เป็น Container บนทุก Environment (Build once Run any where)
- ในตอนนี้แนะนำให้ Run Dover บน Linux OS
- Concept: “Build Once, Run Anywhere” คล้ายกับ CI/CD Pipeline:
CI = Build | Artifact Server = Ship | CD = Run
- Docker Layer/Docker Components
- Docker Image: ไฟล์ต้นแบบสำหรับสร้าง Container
- Docker Container: Instance ของ Docker Image ที่รันอยู่ - Kubernetes: Container Orchestration
Kubernetes เป็นระบบจัดการ Containers หลายตัวแบบอัตโนมัติ เหมาะสำหรับระบบที่ต้องการการ Scale, Reliability, และการบริหารจัดการที่ซับซ้อน - Kubernetes Distribution: มีการพัฒนา Kubernetes แบ่งออกเป็น 3 กลุ่ม:
- Installation Tools: Minikube, Kubespray, Kops, K3S, MicroK8s
- Commercial: OpenShift (Red Hat), VMware Tanzu, Rancher
- Public Cloud: Azure Kubernetes Service (AKS), Amazon Elastic Kubernetes Service (EKS), Google Kubernetes Engine (GKE), etc.
หากใช้ Cloud เจ้าไหน ควรเลือก Kubernetes เจ้านั้นเพื่อการ Integrate ที่ง่ายขึ้น
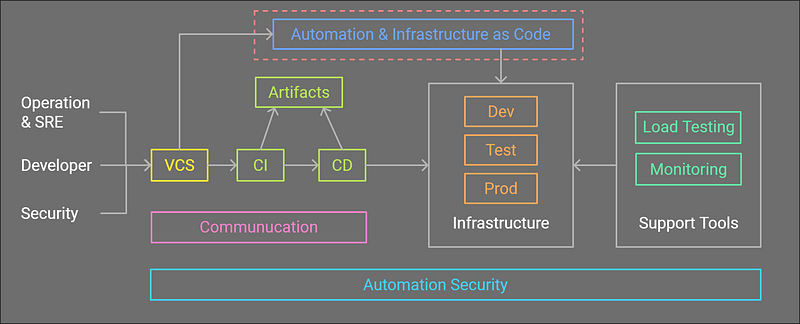
Figure: Automation and Infrastructure as Code (Image by Author)
Infrastructure Automation
Infrastructure Automation เป็นแนวคิดที่ช่วยให้การจัดการระบบ IT มีความง่ายและรวดเร็วมากขึ้น โดยใช้หลักการ Infrastructure as Code (IaC) เพื่อทำให้การกำหนดค่าโครงสร้างพื้นฐานเป็นแบบอัตโนมัติ และสามารถทำซ้ำได้อย่างแม่นยำ
- Infrastructure as Code (IaC)
IaC หมายถึง การกำหนดโครงสร้างของ Infrastructure ผ่าน Code โดยไม่ต้องใช้การตั้งค่าด้วยมือ (No Click Ops) ช่วยลดข้อผิดพลาดและเพิ่มความสามารถในการทำซ้ำ (Reproducibility) เครื่องมือยอดนิยมใน IaC ได้แก่:
- Ansible: สำหรับ Orchestration และ Automation ใช้ภาษา YAML ที่เข้าใจง่าย
- Terraform: สำหรับ Provision และจัดการ Infrastructure
ใช้ Terraform สร้าง Infrastructure และใช้ Ansible ในการ Orchestration
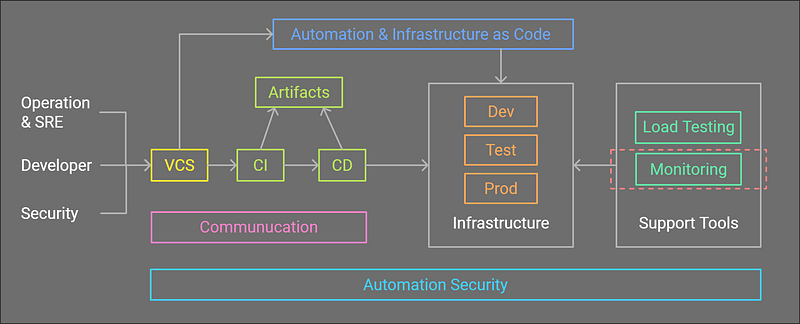
Figure: Monitoring (Image by Author)
4. Monitoring
Monitoring เป็นกระบวนการตรวจสอบและเก็บข้อมูลจากระบบเพื่อวิเคราะห์ประสิทธิภาพ, ตรวจจับปัญหา, และทำ Feedback Loop ในทุกขั้นตอน
ประเภทของ Monitoring Data
- Check (Alert/Status Monitoring): ใช้ตรวจสอบสถานะว่า ระบบทำงานปกติหรือไม่ เช่น 0 = ปกติ, 1 = Error, 2 = ไม่มี Data ส่งมา (บางที่มี)
- Metric (Time-Series Data): ค่าตัวเลขที่เปลี่ยนแปลงตามเวลา เช่น CPU Usage, Memory Usage
- Log (Textual Information): ข้อความที่แสดงข้อมูลการทำงาน เช่น Error Logs
- Tracing (Application Performance Monitoring — APM): แสดงเส้นทางการทำงานของ Application อย่างละเอียด
Monitoring Stack (6 Layers)
- Network: Bandwidth, Latency, Throughput
- Physical Devices: อุณหภูมิ CPU, สถานะพัดลม
- Operating System (OS): CPU Usage, Memory Usage
- Software & Database: จำนวน Requests, Query Latency
- Development Application: Latency ของ API, Error Rate
- Business Layer: รายได้, จำนวนผู้ใช้งาน
Monitoring Tools และ Components
- Collector Sensor: ทำหน้าที่เก็บข้อมูล เช่น StatSD, Fluentd
- Database: จัดเก็บข้อมูล Monitoring เช่น Prometheus, InfluxDB
- Visualization: แสดงข้อมูลใน Dashboard เช่น Grafana, Kibana
- Analysis Alert: วิเคราะห์และแจ้งเตือน เช่น Sensu, Flapjack
Performance Load Testing
- Load Testing: จำลองการเพิ่ม load จาก 0 จนถึงระดับที่กำหนด
- Stress Testing: เพิ่ม load ไปเรื่อย ๆ จนกว่าระบบจะล่ม เพื่อหาจุด breaking point ที่ระบบรองรับได้
- Spike Testing: ทดสอบการรับ load ที่เพิ่มขึ้นแบบฉับพลัน
- Soak Testing: ทดสอบระบบภายใต้ load ที่คงที่เป็นระยะยาว
- Capacity Testing: ประเมินความสามารถของระบบในการรองรับผู้ใช้งาน
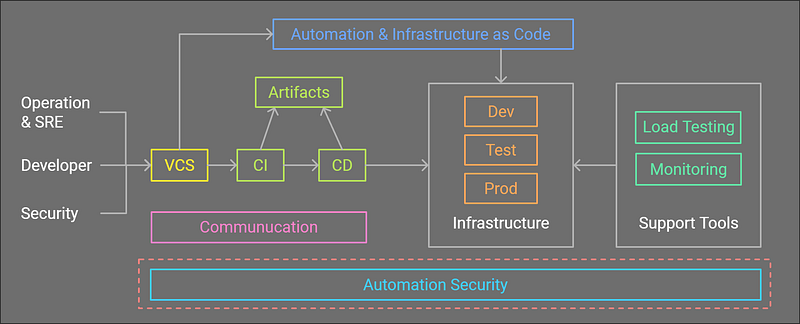
Figure: Automation Security (Image by Author)
5. Automation Security
Automation Security ช่วยเร่งความเร็วและเพิ่มความแม่นยำในการตรวจสอบความปลอดภัย โดยใช้แนวคิด Shift Left (เน้นความปลอดภัยตั้งแต่ต้นกระบวนการ)
Step 1: Precommit Stage
ในขั้นตอนนี้ เน้นไปที่ Source Code Security เพื่อป้องกันปัญหาด้านความปลอดภัยตั้งแต่ต้นทาง โดยแนวปฏิบัติที่สำคัญคือ Secure Coding ซึ่งถึงแม้จะไม่ได้เกี่ยวข้องกับ DevSecOps โดยตรง แต่เป็นพื้นฐานสำคัญที่ Developer ทุกคนควรรู้
- Best Practices in Secure Coding (ตาม OWASP):
- Input Validation: ตรวจสอบข้อมูลที่เข้ามาว่าเป็นไปตามรูปแบบที่คาดไว้
- Authentication & Password Management: หลีกเลี่ยงการเก็บ Password แบบ Plain Text
- Access Control: กำหนดสิทธิ์การเข้าถึงข้อมูล
- Cryptographic Practices: ใช้การเข้ารหัสที่แข็งแรง หลีกเลี่ยงการใช้วิธีล้าสมัย - Static Application Security Testing (SAST):
สแกนโค้ดแบบ Static เพื่อค้นหาช่องโหว่ก่อน Compile หรือ Deploy
ตัวอย่าง Tools: SonarQube, GitLab - Software Composition Analysis (SCA):
วิเคราะห์ 3rd Party Libraries และ Framework เพื่อหาช่องโหว่และความเสี่ยง
ตัวอย่าง Tools: OWASP Dependency Check, GitLab
Step 2: Acceptance Stage
Acceptance Stage มุ่งเน้นการ Security Testing เพื่อให้มั่นใจว่า Application พร้อมใช้งานอย่างปลอดภัยก่อนขึ้น Production
- Penetration Testing (Pen Test):จำลองการโจมตีจาก Hacker เพื่อหาช่องโหว่ (มักเป็น Manual Testing)
- Vulnerability Assessment (VA Scan): ใช้ฐานข้อมูล Vulnerabilities สแกน API หรือ Web-based UI (สามารถทำ Automation ได้ง่าย)
- Fuzz Testing: ใช้ข้อมูลแบบสุ่ม (Brute-force) ใส่ใน Form หรือ Input Fields (Automate ได้ 100%)
- Dynamic Application Security Testing (DAST):
ตรวจสอบ Application ที่รันอยู่ (Dynamic) โดยไม่ต้องเห็น Source Code (เรียกอีกชื่อว่า Black-box Testing)
ตัวอย่าง Tools: GitLab, ZAP (Zed Attack Proxy), Checkmarx - Interactive Application Security Testing (IAST):
ใช้ Agent หรือ Sensor ติดตั้งใน Application (Sidecar) รันไปพร้อมกัน
ตัวอย่าง Tools: Acunetix, Hdiv - Infrastructure as Code (IaC) Security:
สแกน IaC เช่น Ansible, Terraform, Kubernetes เพื่อหา Misconfigurations หรือ ช่องโหว่ - Container Image Security:
สแกน Container Image เพื่อค้นหา Vulnerabilities
ตัวอย่าง Tools: Clair, Trend Micro, Anchore - Signed Container Image:
ยืนยันความถูกต้องของ Container Image ว่าไม่มีการแก้ไขโดยไม่ได้รับอนุญาต - Privileged Access Management (PAM):
- จัดการ Secrets เช่น Credentials, API Tokens
ตัวอย่าง Tools: HashiCorp Vault, CyberArk Conjur
Step 3: Production Stage
Production Stage มุ่งเน้นการ Monitor Security และสร้าง Automation เพื่อปกป้องระบบใน Production อย่างต่อเนื่อง
- Automation Security Baseline:
ตรวจสอบว่าระบบทำงานตามมาตรฐานขั้นต่ำ เช่น CIS, NIST, OpenSCAP - Cloud Security Automation:
ตั้งค่าความปลอดภัยและตรวจสอบระบบ Cloud อย่างต่อเนื่อง - Run-Time Application Security Protection (RASP):
ตรวจจับและบล็อกภัยคุกคามระหว่างที่ Application กำลังทำงาน
ตัวอย่าง Tools: Falco, Trend Micro, Palo Alto Networks - Web Application Firewall (WAF):
Firewall ที่ทำงานอยู่หน้า Application เพื่อดักจับ Pattern ที่น่าสงสัย เช่น SQL Injection, XSS - Security Monitoring:
- Security Event Monitoring (SEM): ตรวจจับ Pattern ที่ผิดปกติ
- Security Operation Center (SOC): ทีมที่ตอบสนองต่อเหตุการณ์ความปลอดภัย
- Security Orchestration Automation Response (SOAR): ใช้ Automation เพื่อตอบสนองต่อเหตุการณ์ได้อย่างรวดเร็ว
- ตัวอย่าง Tools: Splunk, LogRhythm, Datadog
ใน Part 2/3 เราได้เรียนรู้เกี่ยวกับ Infrastructure, Monitoring และ Automation Security ซึ่งเป็นหัวใจสำคัญในการรักษาความปลอดภัยระบบใน DevSecOps ใน Part 3 เราจะเจาะลึกเกี่ยวกับ How to Start DevSecOps ฝากติดตามต่อด้วยนะครับ!
Data Science Explore the world of data science with Donato_Story
Dashboard Discover the power of data visualization with Donato_Story
Donato_Journey Join me on my journey (Thai version)
Course_Review Discover the training courses with Donato_Story (Thai version)
Let’s Connect!
Your feedback is invaluable. Feel free to share your thoughts or questions in the comments below. You can also connect with me on:
- Medium: medium.com/donato-story
- Facebook: web.facebook.com/DonatoStory
- Linkedin: linkedin.com/in/nattapong-thanngam
Originally published on Medium
Related

A Practical Guide to Building Agents
คู่มือปฏิบัติ: การสร้าง Agent ด้วย LLM โดย OpenAI

Continue Exploring Chat Models with LangChain
Data Mastery Series — Episode 31: LangChain Website (Part 6)

Copilot Studio 101
คู่มือการสร้าง AI Chatbot สำหรับผู้เริ่มต้น

Corrective RAG
Data Mastery Series — Episode 53: RAG ที่ “คิด” ก่อน “ตอบ” และ “แก้ไข” เมื่อผิดพลาด