Empowering Everyday Life with Data Analytics: Practical Examples and Tips
A Practical Guide to Making Informed Homebuying Decisions

If you are interested in articles related to my experience, please feel free to contact me: linkedin.com/in/nattapong-thanngam
Data analysis is often regarded as a tool solely utilized within professional settings. However, its application extends far beyond the workplace. In this article, I aim to demonstrate the practicality of data analysis by sharing a real-life example of how it can be leveraged to inform crucial decisions in our everyday lives, specifically in the context of homeownership. Through a step-by-step approach, I will showcase techniques and provide insightful examples that can empower individuals to make well-informed choices when it comes to buying a home.
Step 0. Setting Reasonable Assumptions
Before we dive into data analysis, let’s establish some reasonable assumptions. These assumptions will serve as a basis for our calculations and help us make informed decisions. For this exercise, we’ll assume:
- Loan Amount: 5.9 million baht
- Average Interest Rate: 3.5% (Note: This assumption is based on the belief that it is attainable by refinancing every three years.)
Step 1: Building a Comparative Table for Clarity and Insight
To gain a comprehensive understanding of the financial implications associated with different repayment strategies, we begin by constructing a comparative table. This table serves as a valuable tool, enabling us to visualize and analyze the inflow and outflow of funds throughout the repayment period. By employing the PMT function, we can calculate the monthly repayment amount for various durations, such as 30, 20, 15, 10, or custom terms. Subtracting the total payment from the loan amount reveals the accrued interest, providing valuable insights into the impact of different repayment periods. This analysis becomes a fundamental reference point for determining the optimal repayment amount and strategy. (The calculation formula is shown in column K for reference.)
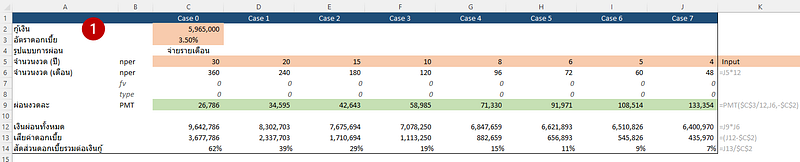
Create Comparative Table (Image by Author)
Step 2: Utilizing Goal Seek for Personalized Monthly Payments
Moving forward, it is common to have a specific monthly payment in mind. Employing the Goal Seek function allows us to find the corresponding repayment duration when the monthly payment is set, providing personalized insights tailored to individual financial circumstances. By setting the monthly payment at, for instance, 65,000 baht, we can determine the number of years required to repay the loan amount.
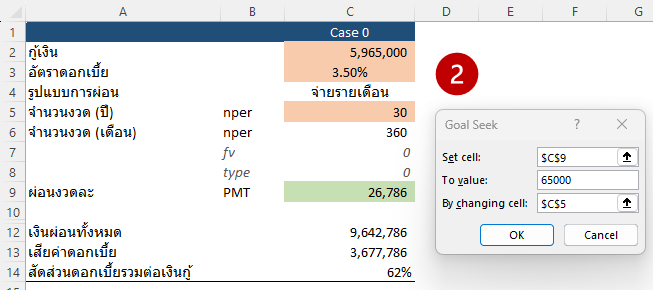
Utilizing Goal Seek (Image by Author)
Step 3: Advanced Analysis through Graphical Visualization
For a more comprehensive understanding, advanced graphical visualization techniques can be applied. Plotting a graph with the monthly payment amount (x) against the number of years (y) enables a visual representation of the relationship between these variables. Observing the graph, it becomes evident that monthly payments below 60,000 baht significantly extend the repayment duration. This phenomenon, reminiscent of the Elbow method, highlights the critical balance between monthly affordability and the total repayment timeline. Furthermore, experimenting with different types of trendlines and evaluating their R-Squared values allows for a deeper exploration of the relationship between monthly payments and repayment duration. The Power Trendline, despite being the most effective fit, often lacks precision in its equation. To overcome this limitation, Excel formulas can be employed to derive the accurate coefficients (a and b) in the Power Trendline equation (y = ax^b).
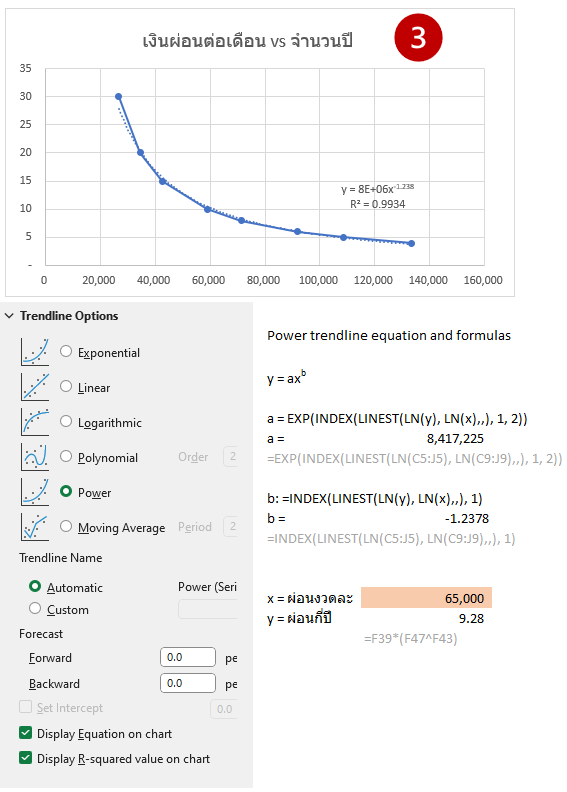
Graphical Visualization (Image by Author)
Step 4: Leveraging Data Tables for Comprehensive Analysis
To enhance the accuracy and ease of analysis, leveraging Data Tables proves to be an effective technique. By manipulating variables, such as extending the repayment period by one year, it becomes possible to calculate the corresponding increase in interest payments. This data-driven approach provides a more comprehensive perspective on the financial implications associated with different repayment strategies.
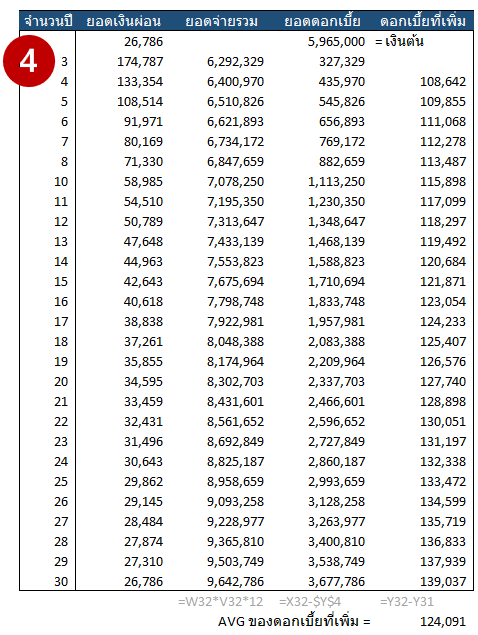
Data Tables (Image by Author)
Conclusion
Harnessing the power of data analysis can revolutionize our decision-making process, even in the realm of homeownership. By employing techniques such as comparative tables, Goal Seek, graphical visualization, and data tables, we can gain valuable insights into optimal repayment strategies that balance monthly affordability and interest payments. Armed with this knowledge, individuals can confidently navigate the complex landscape of homeownership, making informed decisions that align with their financial goals and aspirations.
Thank you for taking the time to read this article! If you found it enjoyable, we recommend checking out these other articles for your reading pleasure.
Data Science _Edit description_medium.com
Dashboard _Edit description_medium.com
Course_Review _Thai version_medium.com
Please feel free to contact me, I am willing to share and exchange on topics related to Data Science and Supply Chain.
Facebook: facebook.com/nattapong.thanngam
Linkedin: linkedin.com/in/nattapong-thanngam
Originally published on Medium
Related

A Practical Guide to Building Agents
คู่มือปฏิบัติ: การสร้าง Agent ด้วย LLM โดย OpenAI

AI in the Enterprise โดย OpenAI
ถอดรหัสเคล็ดลับองค์กรระดับโลก ปลดล็อกศักยภาพ AI สร้างความได้เปรียบทางธุรกิจ

Best Practices for Bar Charts
Visualization Series — Episode 2

Best Practices for Line Charts
Visualization Series — Episode 3