Production planning Optimization
by excel solver
by excel solver

If you are interested in articles related to my experience, please feel free to contact me: linkedin.com/in/nattapong-thanngam
Introduction:
During optimization training, my student asks me “We have many plants, many product grades, 1 plant can produce only 1 product grade per time. How to optimize production schedules if production costs of each plant are different and if re-start, switching grades have additional cost?”.
Step 0:
Based on the question, I will convert abstract question to mathematic quiz as below
- Optimize total operation cost
- 3 plants (1, 2, 3) and 3 product grades (A, B, C)
- 1 plant can select to produce 1 product per day
- Supply has to cover demand
- To optimize cost, the plant can run at full load or shut down
- The minimum stock of product A/B/C = 10/20/15
- Start plant/Switching grade cost = 200 $ per time
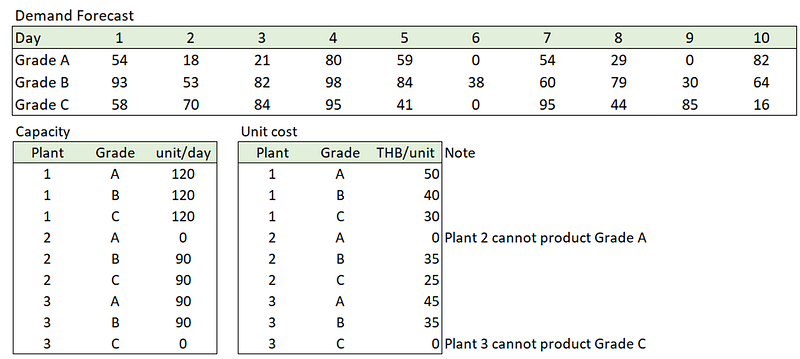
Simulation data for optimization problem (Image by Author)
Note: all data is only for simulation (not real)
Step 1: Start with simplify the question
In the 1st step, I suggest reducing complexity of question in order to check formula, equation, and answer that go to right way.
- Start with Excel → Create Balance Equation, Set up Constraint and Decision variable, Objective function.
- Reduce date to only 3–5 days (Excel has solver limitation)
- Ignore some constraints (switching cost, 1 product type/1 day)
- Example equation
- Begin stock (t) = End stock (t-1) + Supply (t)
- End stock (t) = Begin stock (t) - Demand (t)
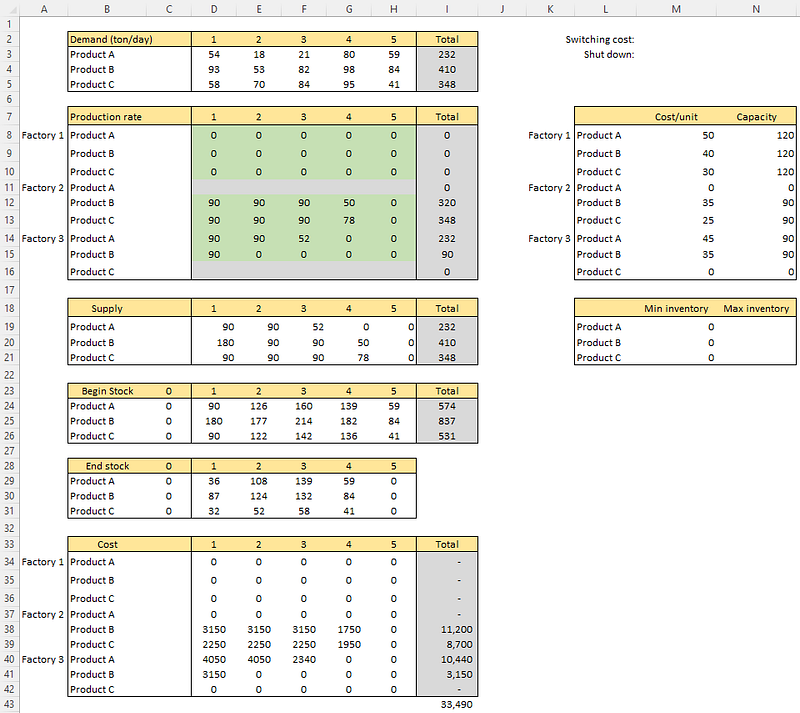
Balance equation and Result of 1st step (Image by Author)
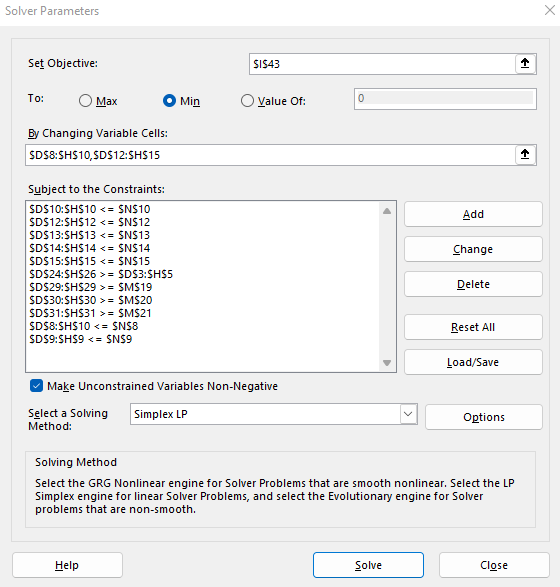
Optimization setting (Image by Author)
As the result, only plant 2 and plant 3 are selected and Last day inventory of all products is Zero. It means we go the right way (only high-efficiency plants are selected and not over-production).
Note: In a corrected way, we should write mathematical model. However, this article will skip this part.
Step 2: Increase complexity of model (step by step)
In the 2nd step, add constraints 1 product type/1 day.
- Add decision variable as binary parameter (0,1) and set equation as following
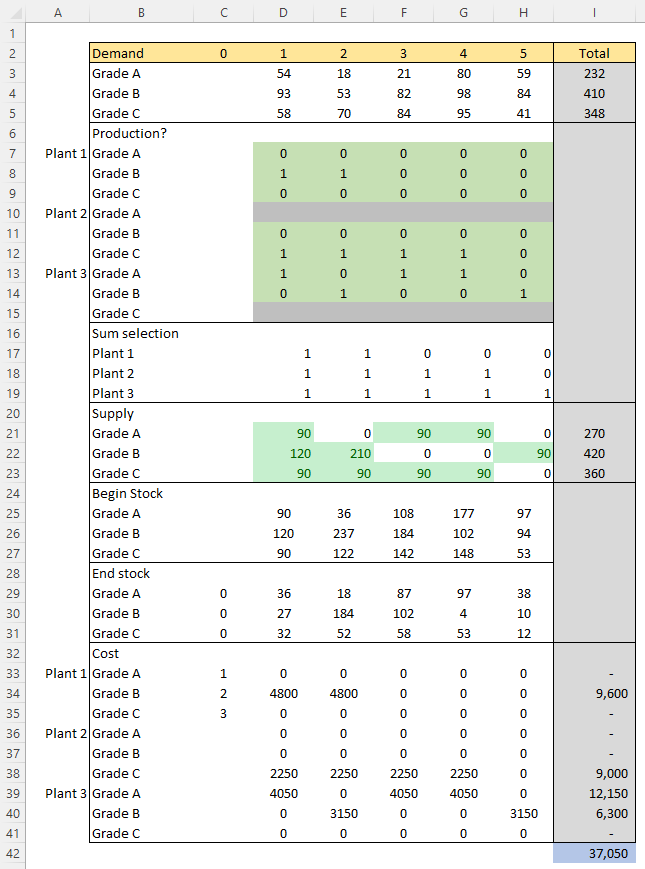
Balance equation and Result of 2nd step (Image by Author)
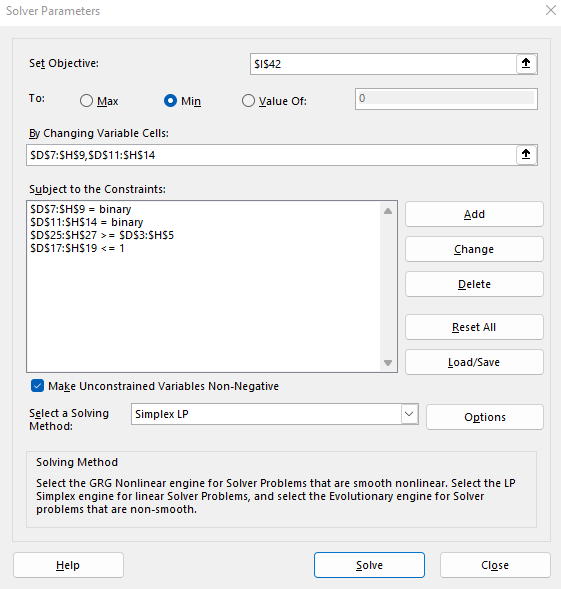
Optimization setting (Image by Author)
Step 3: Increase complexity of model (again)
In the 3nd step, add switching cost and minimum stock
- How to add switching costs?
Example formula of D50 = ( --((D7>C7))) - Trick → If solver cannot solver in first round, you can force Plant 1 to product grade B on the 1st day.
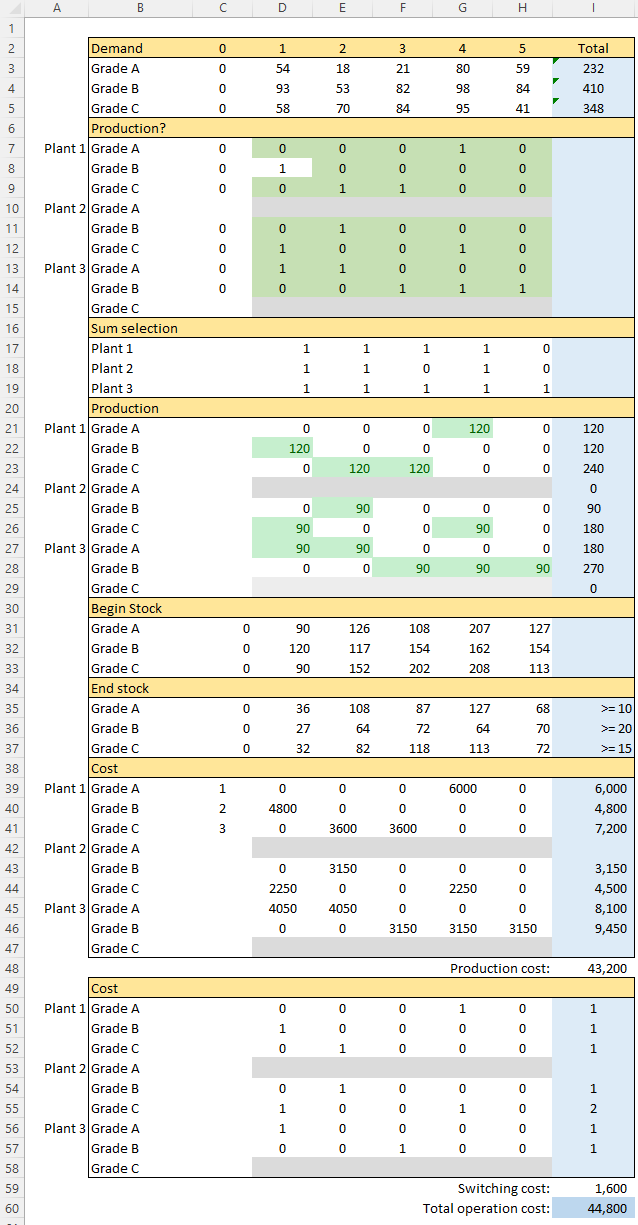
Balance equation and Result of 4th step (Image by Author)
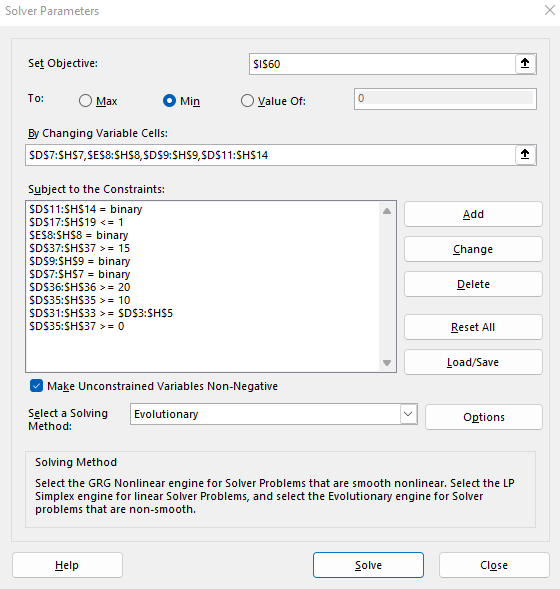
Optimization setting (Image by Author)
Step 4: Final step
- To use Excel program, we have to install OpenSolver.
- To quick solve, change equation from non-linear to linear by using BigM
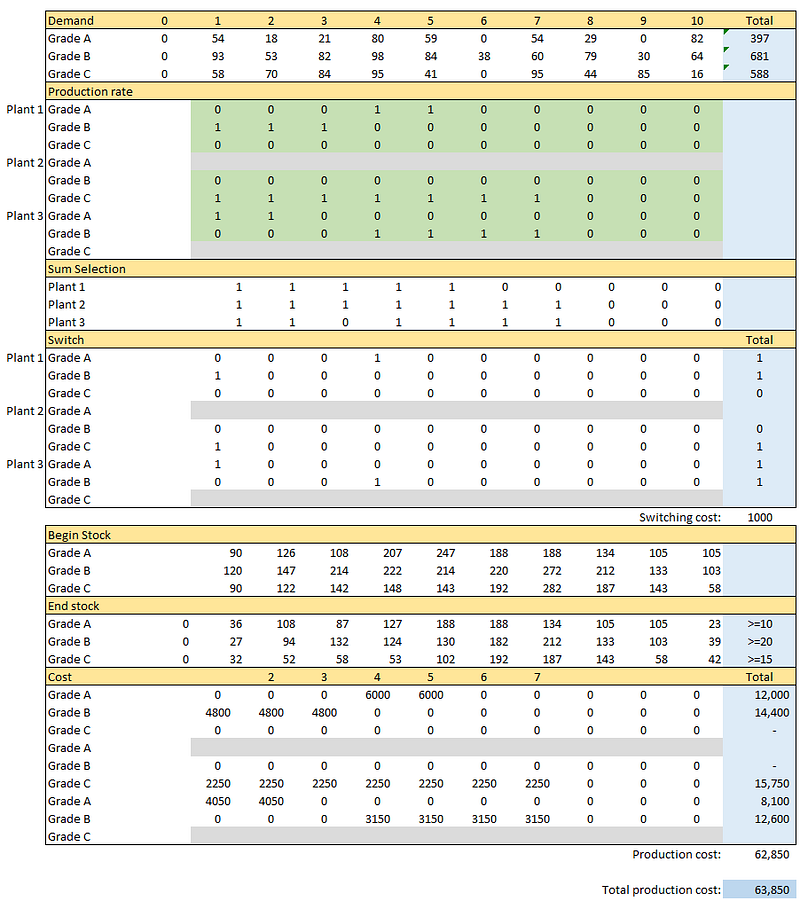
Balance equation and Result of final step (Image by Author)
Please feel free to contact me, I am willing to share and exchange on topics related to Data Science and Supply Chain.
Facebook: facebook.com/nattapong.thanngam
Linkedin: linkedin.com/in/nattapong-thanngam