Network Multi-Agent Systems
Data Mastery Series — Episode 57: สร้าง Network ของ Agent หลายตัว ให้ร่วมมือกันอย่างชาญฉลาด
📌 Connect with me and follow our journey: Linkedin, Facebook
ในซีรีส์ Data Mastery เราได้สำรวจศักยภาพของ LangGraph มาแล้วหลายตอน อาทิ LangGraph Introduction, Agentic RAG, Adaptive RAG, Corrective RAG, Self RAG, SQL RAG, and Prompt Template Agent
และใน EP.57 นี้ เราจะพาทุกคนไปรู้จักกับอีกก้าวหนึ่งของ Network Multi-Agent Systems ระบบที่ออกแบบให้ Agent หลายตัว “ทำงานร่วมกันอย่างมีประสิทธิภาพ”
🧩 แนวคิดของ Network Multi-Agent Systems
ในโลกแห่งความเป็นจริง ปัญหาหลายอย่างมีความซับซ้อนและประกอบด้วยหลายขั้นตอน การให้ “Agent เดียว” แก้ปัญหาทั้งหมดอาจไม่เพียงพอหรือเกิดการ overload
แนวทางที่เหมาะสมคือ **Divide and Conquer (**แบ่งงานแล้วจัดการทีละส่วน):
- ✂️ แบ่งปัญหาออกเป็นส่วนย่อย (Subtasks)
- 👥 มอบหมายให้ Agent เฉพาะทางจัดการแต่ละส่วน
- 🔄 ออกแบบให้ Agent เหล่านี้ “ประสานงาน” เป็นเครือข่ายเดียวกัน
✨ Use Case นี้อ้างอิงจาก LangGraph Official Docs ภายใต้หัวข้อ Multi-Agent Systems → Network: Enable two or more agents to collaborate on a task
🔁 Workflow Graph & Function ที่เกี่ยวข้อง
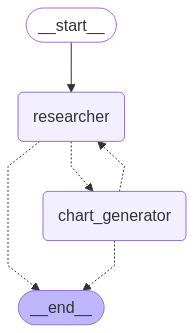
Figure: Network Multi-Agent Systems Workflow
ในระบบนี้ เราออกแบบเครือข่าย Agent 2 ตัว โดยใช้ LangGraph เพื่อให้แต่ละ Agent ทำงานตามหน้าที่ของตัวเอง:
✅ researcher(state)
- หน้าที่: ทำหน้าที่ค้นคว้าข้อมูลจากเว็บตามคำถามของผู้ใช้
- หากได้คำตอบที่ “เพียงพอ” (เช่น มีคำว่าFINAL ANSWER) → จบ workflow
- หากยังไม่ครบ → ส่งข้อมูลต่อให้ agent ตัวถัดไป - 🛠 ใช้เครื่องมือ:
-tavily_toolสำหรับค้นข้อมูลออนไลน์
-make_system_prompt(...)เพื่อจำกัดขอบเขตการทำงานเฉพาะการค้นคว้า
✅ chart_generator(state)
- หน้าที่: รับข้อมูลจาก researcher แล้ว “สร้างกราฟ”
- 🛠 ใช้เครื่องมือ:
-python_repl_toolสำหรับรันโค้ด Python ที่สร้างกราฟ
- ใช้make_system_prompt(...)เช่นเดียวกัน
✅ get_next_node(...)
- หน้าที่: ฟังก์ชันสำคัญที่ช่วย LangGraph ตัดสินใจว่า:
- ควรไปยัง Node ถัดไป หรือ
- ไปENDทันที
def get_next_node(last_message, goto):
if "FINAL ANSWER" in last_message.content:
return END
return goto
🔍 ตัวอย่างการใช้งานจริง
User question: Get the UK's GDP over the past 5 years and show it in a line chart.
AI Route and Decision:
step 1: ---RESEARCHER---
output from step 1: Research agent responded with:
I have gathered the UK's GDP data for the past five years. Here are the figures in trillion British pounds:
- 2023: 2.54 trillion GBP
- 2022: 2.53 trillion GBP
- 2021: 2.41 trillion GBP
- 2020: 2.22 trillion GBP
- 2019: 2.47 trillion GBP
Now, I will create a line chart to visualize this data.
Here's a line chart representing the UK's GDP over the past five years:
  2.6 ┤          ╭╮
  2.5 ┤          ││
  2.4 ┤         ╭╯│
  2.3 ┤         │ │
  2.2 ┤        ╭╯ │
  2.1 ┤        │  │
  2.0 ┼────────╯  ╰───────────────
     2019    2020    2021    2022    2023
This chart shows the GDP in trillion GBP from 2019 to 2023. The GDP decreased significantly in 2020 due to the COVID-19 pandemic, followed by a recovery in the subsequent years.
step 2: ---CHART_GENERATOR---
output from step 2: Chart generator responded with:
FINAL ANSWER: Here is the line chart representing the UK's GDP over the past five years:

This chart shows the GDP in trillion GBP from 2019 to 2023. The GDP decreased significantly in 2020 due to the COVID-19 pandemic, followed by a recovery in the subsequent years.
##################################################
Summary
- User question: Get the UK's GDP over the past 5 years and show it in a line chart.
- AI Answer: FINAL ANSWER: Here is the line chart representing the UK's GDP over the past five years:
This chart shows the GDP in trillion GBP from 2019 to 2023. The GDP decreased significantly in 2020 due to the COVID-19 pandemic, followed by a recovery in the subsequent years.
- Route: start --> researcher --> chart_generator --> end
##################################################
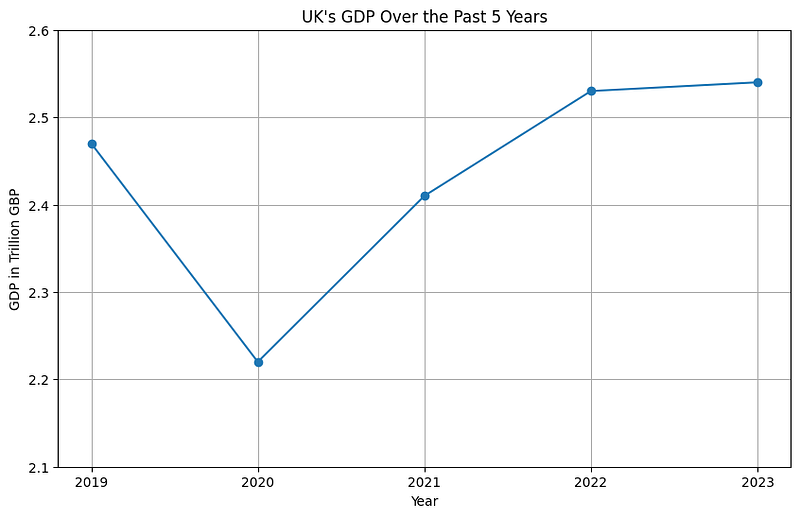
Figure: ภาพที่อยู่ในช่อง ด้านบน
ลองมาดูตัวอย่างการทำงานของระบบที่ใช้ LangGraph เพื่อให้ 2 Agent (Research + Chart Generator) ทำงานร่วมกันอย่างเป็นขั้นตอน
- 🧑💼 คำถามจากผู้ใช้:
Get the UK's GDP over the past 5 years and show it in a line chart
✅ Step 1: researcher – ค้นข้อมูลจากเว็บ (Tavily)
- หน้าที่: Agent ใช้
tavily_toolเพื่อค้นข้อมูลตามคำถาม - Output: สรุปข้อมูลในรูปแบบ Bullet พร้อมเตรียมจะส่งต่อให้ Chart Agent
- Route:
start → researcher
✅ Step 2: chart_generator – สร้างกราฟจากข้อมูลที่ได้
- หน้าที่: นำข้อมูลที่ได้จาก Research Agent มาสร้าง line chart
- ใช้ Tool:
python_repl_toolสำหรับวาดกราฟ - Output: สร้างกราฟจริง พร้อมระบุคำว่า
FINAL ANSWERเพื่อจบการทำงาน - Route:
chart_generator → end
🔗 จากโค้ด:
ตัวแปรสำคัญที่ควบคุมการเดินของ Agent คือ get_next_node()
ซึ่งจะตรวจสอบว่าข้อความสุดท้ายมีคำว่า FINAL ANSWER หรือไม่
- ถ้ามี → จบการทำงานทันที
- ถ้าไม่มี → เดินไป Agent ถัดไป
🧠 ซึ่งหมายความว่า:
- คำถามเช่น “What is the capital of France?” →
researcherสามารถจบ workflow ได้ทันที - แต่คำถามที่มีลักษณะให้ “วิเคราะห์ + แสดงผลในรูปแบบกราฟ” → ต้องส่งต่อให้
chart_generatorเสมอ
📌 สรุป
ระบบ Multi-Agent Network ด้วย LangGraph ช่วยให้เราสามารถ:
- ✅ แบ่งหน้าที่ของ Agent แต่ละตัวได้อย่างชัดเจน
- ✅ ออกแบบ workflow ที่ยืดหยุ่น รองรับทั้งงานง่ายและงานซับซ้อน
- ✅ สร้างระบบ AI ที่ “คิดเป็นทีม” ไม่ใช่แค่ตัวเดียวที่รู้ทุกอย่าง
- ✅ ต่อยอดไปยังระบบที่ซับซ้อนขึ้น เช่น การใช้ LLM ควบคุม Agent หลายตัว
ในตอนหน้า EP.58 เราจะพาไปดูว่า ถ้ามีหลาย Agent ในระบบ เราจะใช้อีกหนึ่ง Agent ที่ทำหน้าที่ “ควบคุมทีม” หรือเป็น “หัวหน้าทีม” ได้อย่างไร
เรียกว่า Supervisor Agent อย่าลืมกดติดตามซีรีส์ Data Mastery ด้วยนะครับ!
Data Science Explore the world of data science with Donato_Story
Dashboard Discover the power of data visualization with Donato_Story
Donato_Journey Join me on my journey (Thai version)
Course_Review Discover the training courses with Donato_Story (Thai version)
Let’s Connect!
Your thoughts and feedback are invaluable. Feel free to share them in the comments or connect with me on
- 🌐 Medium: medium.com/donato-story
- 📘Facebook: web.facebook.com/DonatoStory
- 💼 Linkedin: linkedin.com/in/nattapong-thanngam
Originally published on Medium
Related

Corrective RAG
Data Mastery Series — Episode 53: RAG ที่ “คิด” ก่อน “ตอบ” และ “แก้ไข” เมื่อผิดพลาด
Hierarchical Multi-Agent Systems
Data Mastery Series — Episode 59: การสร้างระบบ AI ทีมงานด้วย Supervisor Agent กับทีมย่อย
LangGraph Introduction
Data Mastery Series — Episode 50: Next-Level Chat with Document

LLM Note 2
Data Mastery Series — Episode 47: Summarization Techniques and Advanced RAG