Machine Failure Prediction
NIDA class — Smart Logistic and supply chain automation

If you are interested in articles related to my experience, please feel free to contact me: linkedin.com/in/nattapong-thanngam
Assignment:
- Data source name: AI4I 2020 Predictive Maintenance Dataset Data Set
- Target: Accuracy off precision ≥ 98%
Data source overview:
- 10,000 data points + 14 features (not time series data)
- Highlights features:
- 10,000 product ID that separate to 3 sizes [L (50%), M (30%), H (20%)]
- Air temperature [K], Process temperature [K]
- Rotational speed [rpm], Torque [Nm], Tool wear [min]
- Machine failure [0 = pass,1 = fail]
Step 1) Data Visualization:
- Example of raw data
- Delete Process Temperature column and add Diff_temperature (Process temp. — Air temp.)

(1) Data Preview (Image by Author)
- Bar chart, Heat Map, Histogram plot, Box plot, and Scatter plot are used for visualization
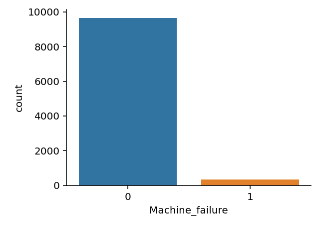
(2) Machine failure (Image by Author)
Pass = 9661
Fail = 339
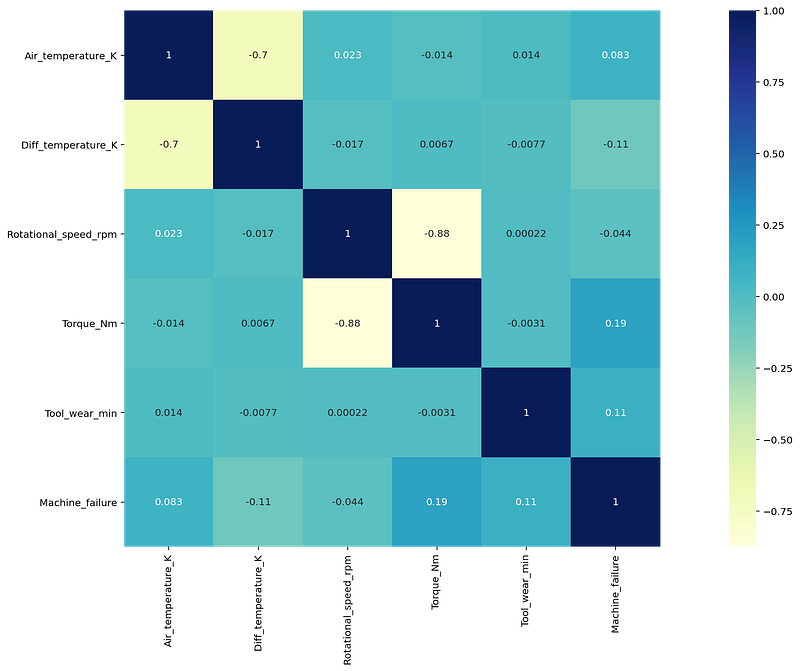
(3) Data visualization by Heat map (Image by Author)
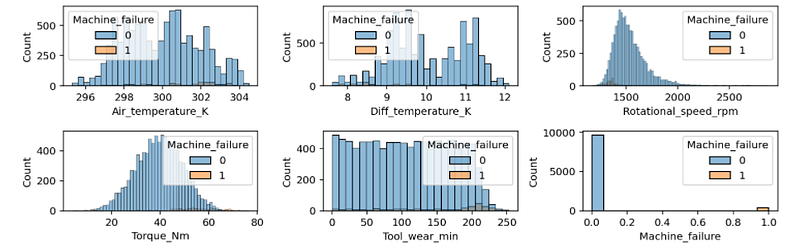
(4) Data visualization by Histogram plot (Image by Author)
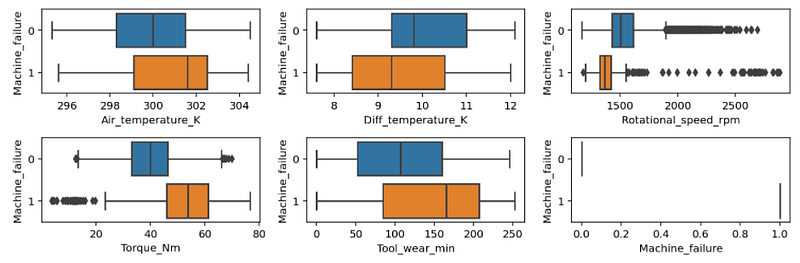
(5) Data visualization by box plot (Image by Author)
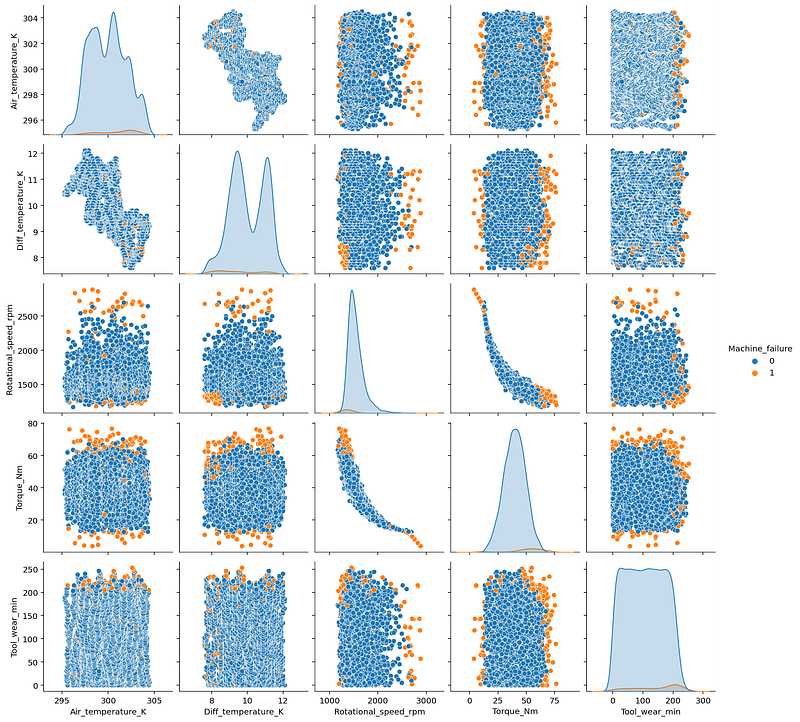
(6) Data visualization by box plot (Image by Author)
- Brief information after visualization
- Imbalance data
- Failure zone = edge of some parameter (Rotating speed, Torque)
Step 2) Add feature:
- Increase features from 5 to 23 feature such as
- Air_Temp^2 = Air_temp. * Air_temp.
- Dummy variable of product type (L, M, H)
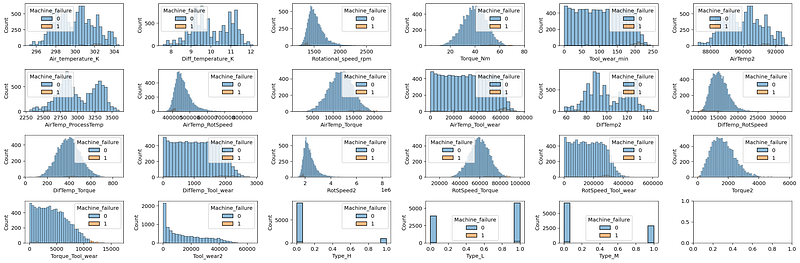
(7) Histogram plot after add feature (Image by Author)
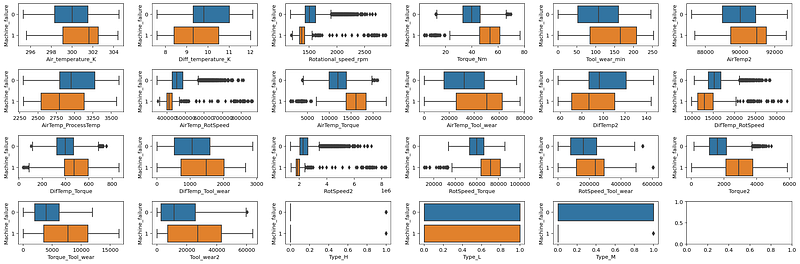
(8) Box plot after add feature (Image by Author)
Step 3) Model evaluation:
- After split data to train and test, I select 11 algorithms and 3 voting_algorithem.
- VotingClassifier1 = 1:1:1:1 = GradientBoostingClassifier:XGBClassifier: RandomForestClassifier:AdaBoostClassifier
- VotingClassifier2 = 1:1:1 = XGBClassifier:GradientBoostingClassifier: AdaBoostClassifier
- VotingClassifier3 = 1:1 = XGBClassifier:GradientBoostingClassifier
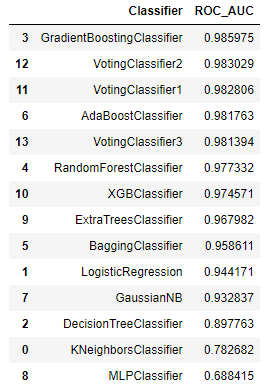
(9) AUC score ranking (Image by Author)
- Use Confusion Matrix to select the best algorithm
Step 4) Feature important:
- Use Gradient Boosting Classifier to select 13 features important.
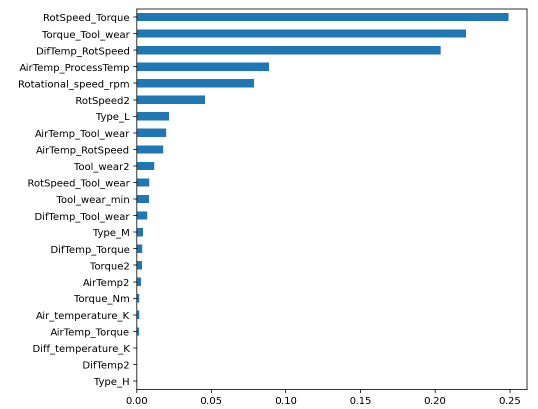
(10) Feature important (Image by Author)
- Run the model again. Top AUC scoring increase from 0.985975 to 0.988210
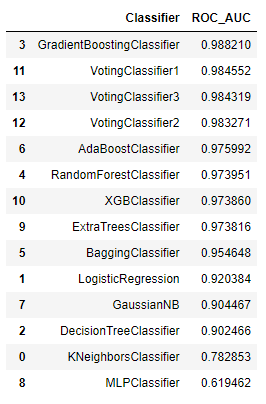
(11) AUC score ranking after feature important (Image by Author)
Step 5) Use selected feature with imputation method
- Gradient Boosting Classifier with no-imputation still be the highest score
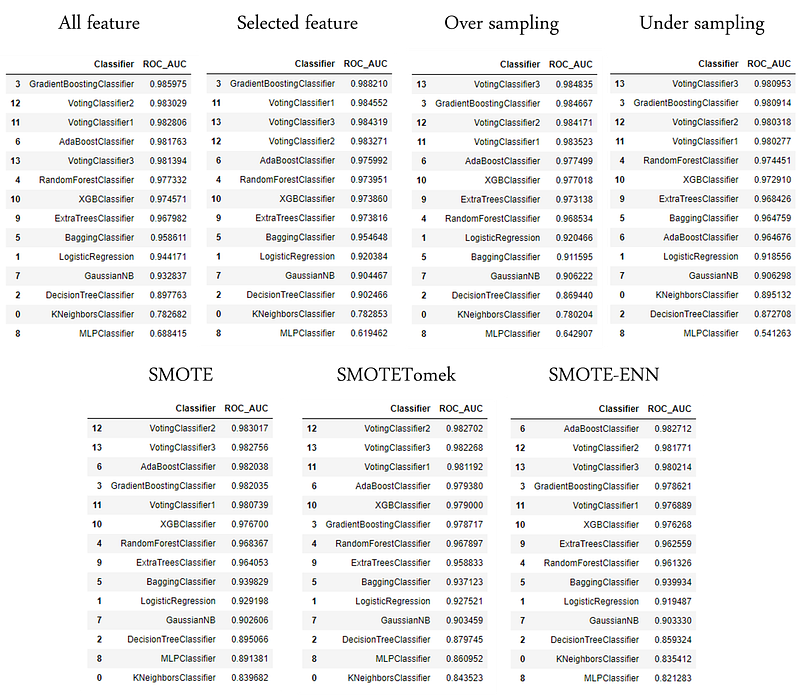
(12) AUC score ranking after feature important with imputation (Image by Author)
- Comparison of data profiling before/after resampling.
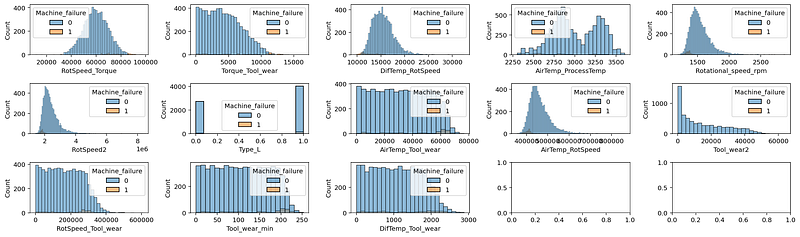
(13) Data profiling before resampling (Image by Author)
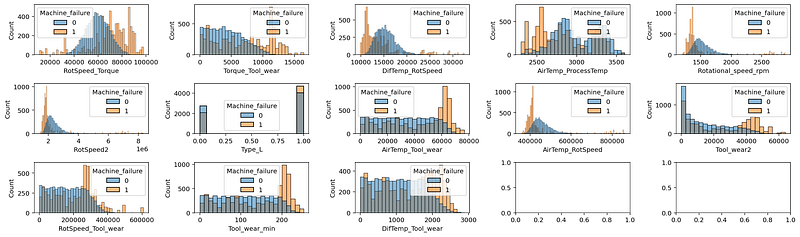
(14) Data profiling after resampling (ex. oversampling) (Image by Author)
Step 6) Summary
- The best model has AOU scoring = 98.8%
(Gradient Boosting Classifier with selected parameter and no imputation) - This model can use to support Predictive Maintenance (PM) to reduce unplanned shutdown, prepare manpower, manage storage, etc.
Note:
- Selected parameters have an impact on AUC scoring
- Note only AUC scoring, I think we should focus on Confusion Matrix too.
- Sometimes we want to minimize False Positive (FP).
- Sometimes we want to minimize False Negative (FN).
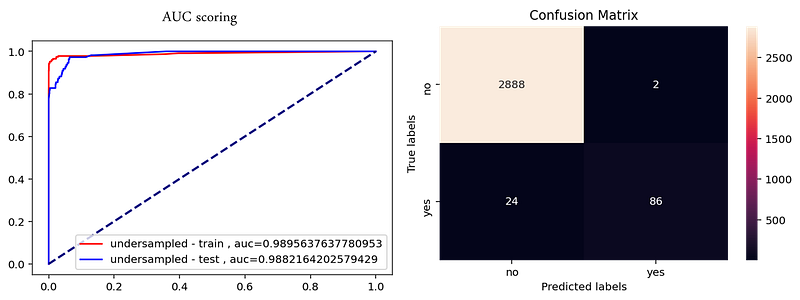
(15) AUC score ranking after feature important with imputation (Image by Author)
Additional: To maximize AUC scoring
Select features important by algorithm voting
- Select popular parameter (cutting score > 3) => 12 features
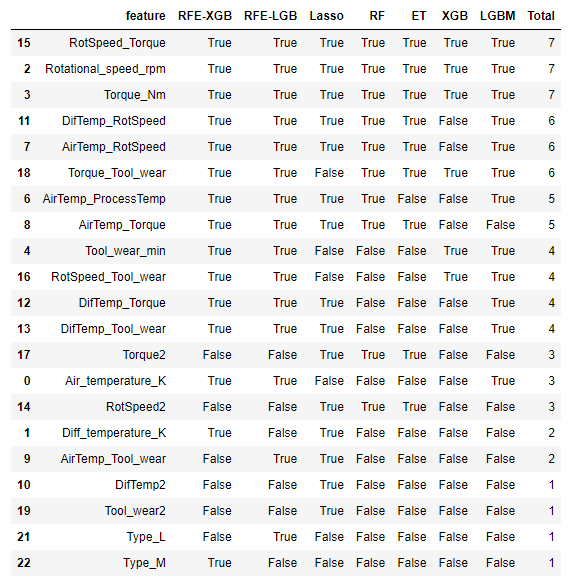
(16) Voting important parameter (Image by Author)
- Use 12 selected parameters with 3 algorithms (GradientBoostingClassifier, XGBoost, and LightGBM) with 6 resampling methods (Non-sampling, Oversampling, Undersampling, Smote, Smote-ENN, and Smote-Tomek) to do AUC scoring by separate train, validation, and test.
- Select 2 highest AUC scoring for tuning:
- 98.78% → GradientBoostingClassifier with Oversampling
- 98.75% → XGBoost with Oversampling
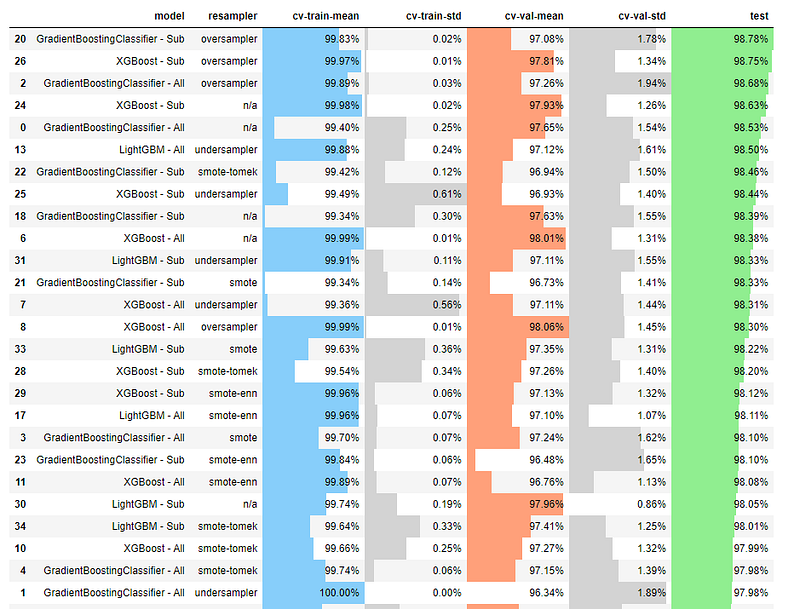
(17) Voting important parameter (Image by Author)
Tuning result:
- 98.94% → GradientBoostingClassifier with Oversampling
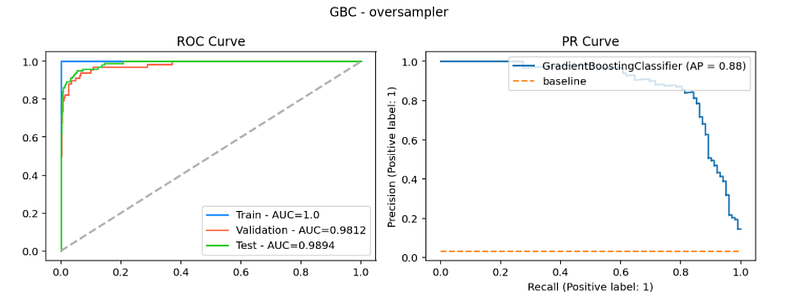
(18) GradientBoostingClassifier with Oversampling after tuning (Image by Author)
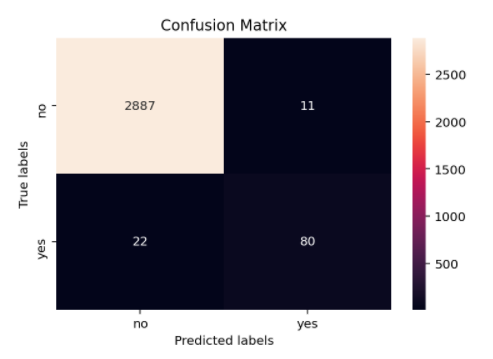
(19) Confusion Matrix of GradientBoostingClassifier with Oversampling after tuning (Image by Author)
- 99.02% → XGBoost with Oversampling
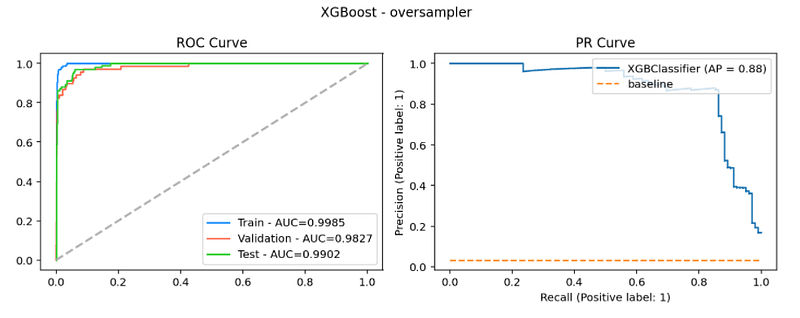
(20) XGBoost with Oversampling after tuning (Image by Author)
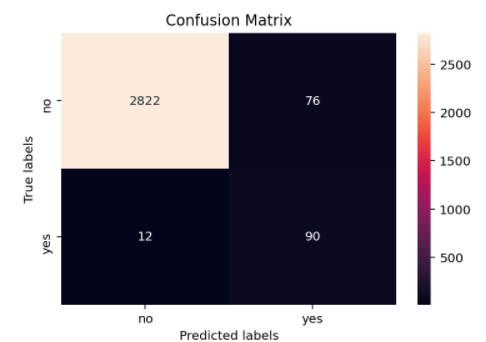
(21) Confusion Matrix of XGBoost with Oversampling after tuning (Image by Author)
Summary
- GradientBoostingClassifier with Oversampling is better because it has lower False Positive (FP) and False Negative (FN).
- Reconfirm feature important with the selected model and use SHAP value to see the effect when the value of parameter changes.
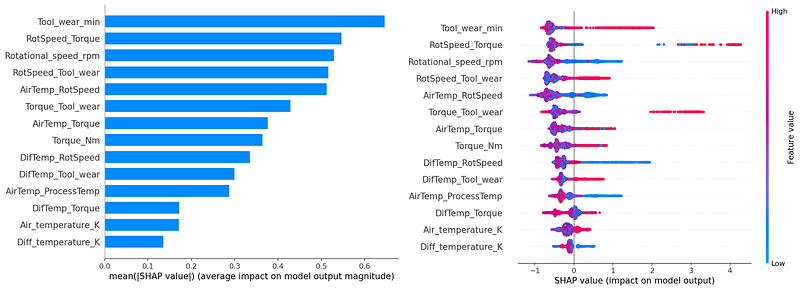
(22) Confusion Matrix of XGBoost with Oversampling after tuning (Image by Author)
Additional: Implementation
- For implementation, it should create criteria for easy understanding.
- Tree diagram is a tool in the fields of general mathematics, probability, and statistics that helps calculate the number of possible outcomes of an event or problem, and to cite those potential outcomes in an organized way.
- Tree diagram of GradientBoostingClassifier with Oversampling is too complicated. (Too detail cannot upload original image)

(23) Tree diagram of GradientBoostingClassifier with Oversampling (Image by Author)
- Tree diagram of Decision tree has acceptable accuracy and easy to implement. It can use to develop work instruction (WI) to reduce machine break down.
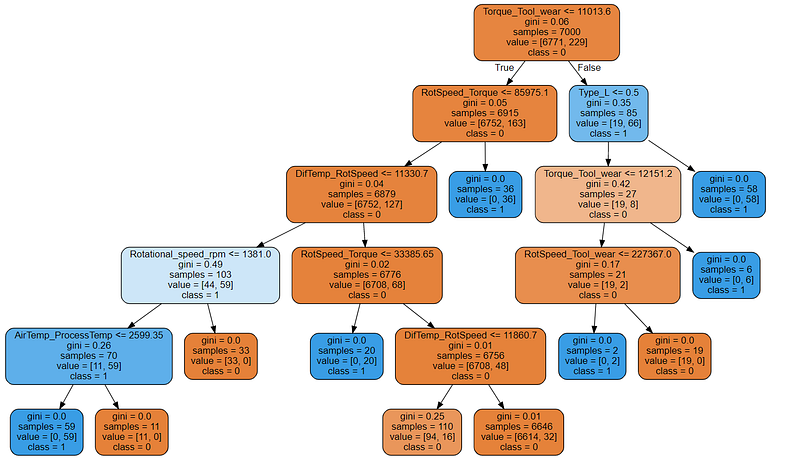
(24) Tree diagram of Decision tree (Image by Author)
Note:
- Thank you Teacher Akkaranan at NIDA for the challenge question,
Teacher Thanachart at NIDA, and P’Tanat for the excellent class (many python codes, I learn from CRM classroom)
Please feel free to contact me, I am willing to share and exchange on topics related to Data Science and Supply Chain.
Facebook: facebook.com/nattapong.thanngam
Linkedin: linkedin.com/in/nattapong-thanngam
Originally published on Medium
Related
A Guide to Sampling Techniques: CRISP-DM Data Preparation
Data Mastery Series — Episode 7: Data Sampling

Adaptive RAG
Data Mastery Series — Episode 52: ปรับ RAG ให้ “รู้จักประเมินสถานการณ์” ก่อนลงมือค้นข้อมูล

Agentic RAG
Data Mastery Series — Episode 51: เปลี่ยน RAG ให้ “คิด” ได้
CRISP-DM: Business Understanding as the Foundation of Data Mining
Data Mastery Series — Episode 2: Busines Understanding