Data Preparation in CRISP-DM: Exploring Imputation Techniques
Data Mastery Series — Episode 5: Missing Data and Imputation

If you are interested in articles related to my experience, please feel free to contact me: linkedin.com/in/nattapong-thanngam
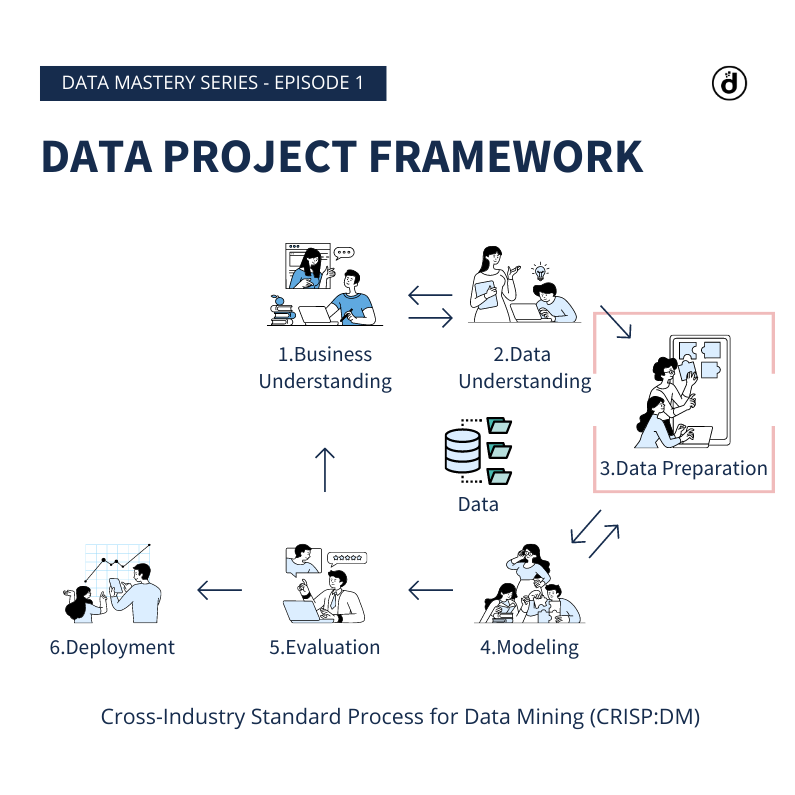
CRISP-DM framework (Image by Author)
Missing data is a common issue in data preparation and analysis. Missing values can lead to biased or unreliable results, and it is necessary to handle them appropriately. One common approach to handling missing data is imputation, which involves estimating the missing values based on the available data. In this article, we will discuss the different types of missingness and the 9 commonly used imputation techniques.
Type of Missingness:
- MCAR (Missing Completely At Random): Missing values occur completely at random and have no relationship with other variables or data. For example, data might be missing because of
- Malfunctioning sensor/equipment. Ex. Data is lost due to a computer malfunction.
- Respondents to a survey forget to answer a question, but the missingness is unrelated to the content of the question. - MAR (Missing At Random): Missing values have a systematic relationship with other variables but can be explained by other variables in the data set. For example,
- In a survey, respondents with higher income are less likely to report their income.
- In a study of education, students with higher test scores are more likely to provide complete data. - MNAR (Missing Not At Random): Missing values have a systematic relationship with the missing data itself, and the missingness cannot be explained by other variables in the data set. For example,
- In a medical study, patients who drop out of the study due to side effects of a medication may have more severe side effects than those who remain in the study, resulting in missing data that is related to the unobserved variable of side effect severity.
Data Set:
- Titanic Dataset: Link
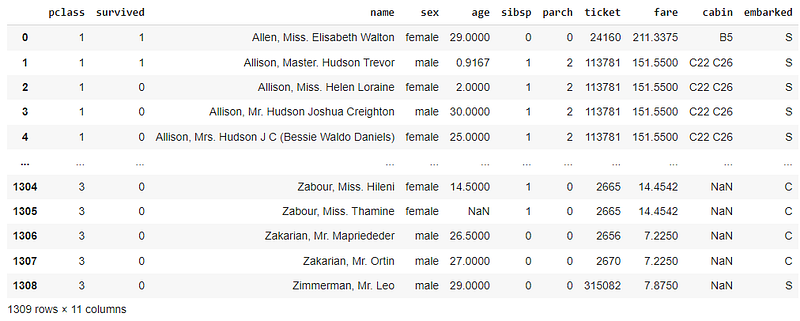
Titanic Dataset (Image by Author)
- Data Preparation by 1) Drop “Cabin” Column, 2) Drop remaning NULL values, and 3) Select columns only pclass, sex, age, sibsp, parch, fare.
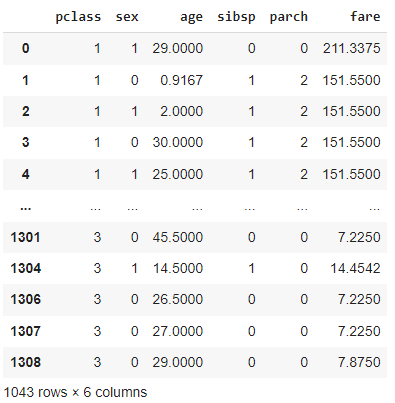
Data Preparation (Image by Author)
- Replace 31 values (age) to NULL for imputation testing
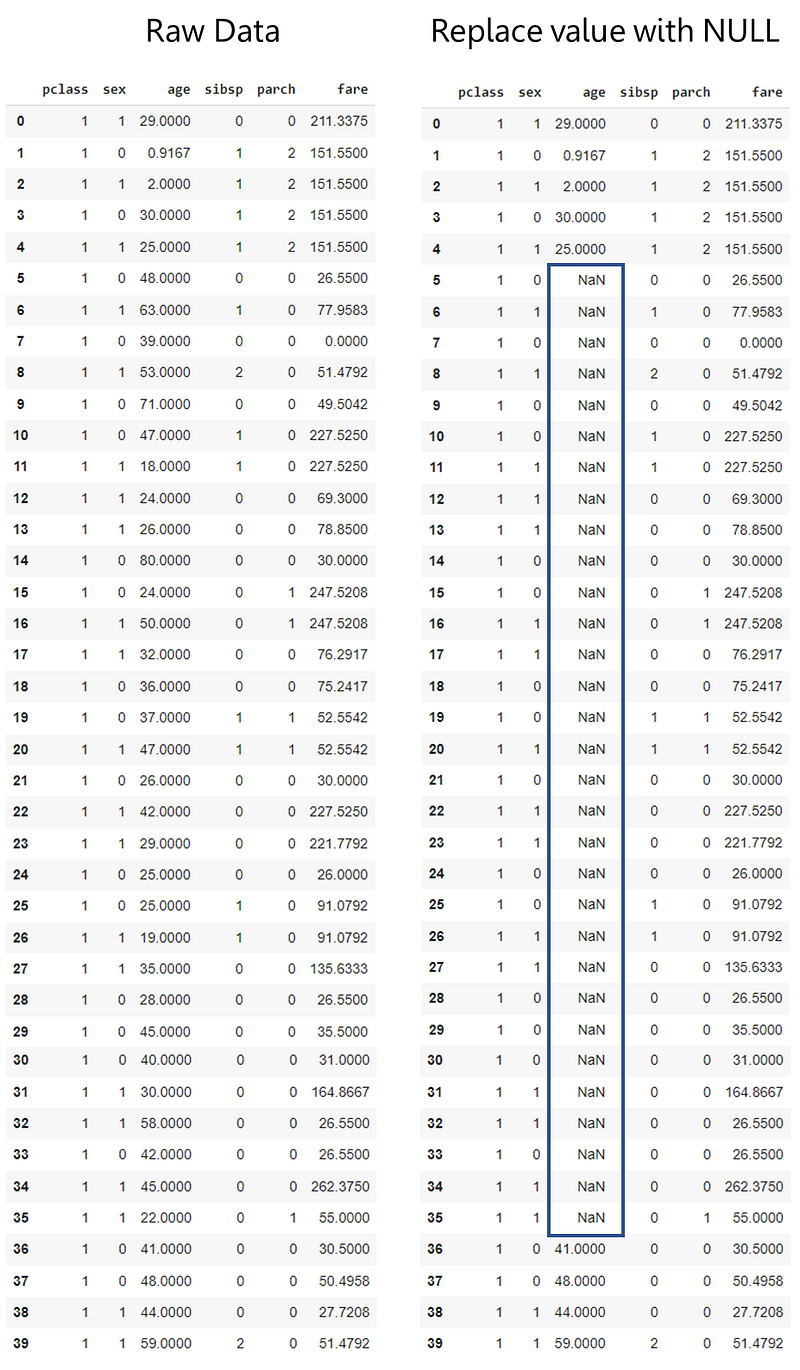
Data Preparation (Image by Author)
9 Imputation Techniques Comparison:
1. Imputation Using Most Frequent or Constant Values: This involves replacing missing values with the mode or the constant value in the data set.
- Mean imputation: replaces missing values with the mean of the available values in the data set.
- Median imputation: replaces missing values with the median of the available values in the data set.
- Mode imputation: replaces missing values with the mode (most frequent value) in the data set.
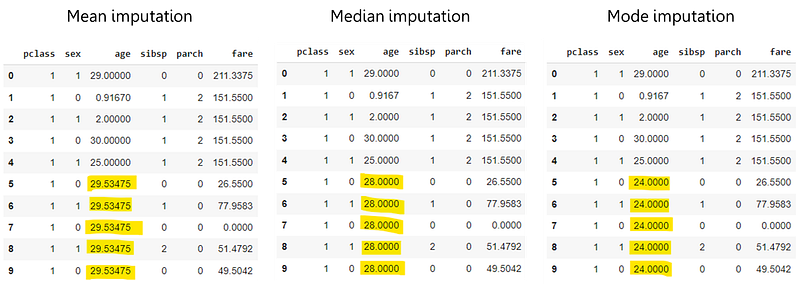
Imputation Using Constant Values (Image by Author)
2. Regression Imputation: This involves using regression analysis to predict the missing values based on the relationships between the variables in the data set.
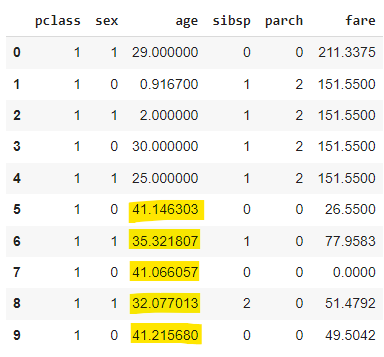
Regression Imputation (Image by Author)
3. KNN Imputation: This involves using the k-nearest neighbors of each observation with missing values to impute the missing values. For this example, I assume K = 5.
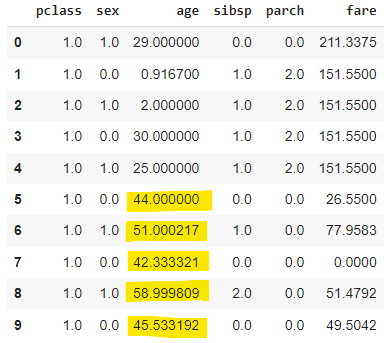
KNN Imputation (Image by Author)
4. Multiple Imputation: This involves generating several plausible values for each missing value and then analyzing the data multiple times using these imputed values to obtain an estimate of the missing values.
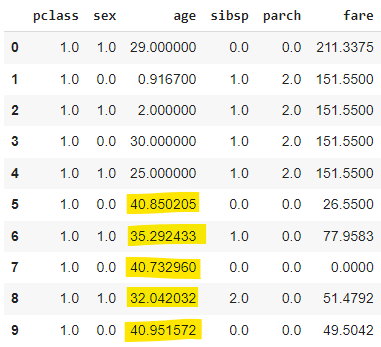
Multiple Imputation (Image by Author)
5. Hot-deck Imputation: This involves imputing the missing values with values from similar observations in the same data set.
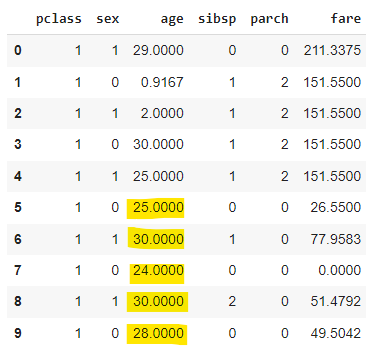
Hot-deck Imputation (Image by Author)
6. Last Observation Carried Forward (LOCF): This method uses the last available observation to fill in the missing values for subsequent time points.
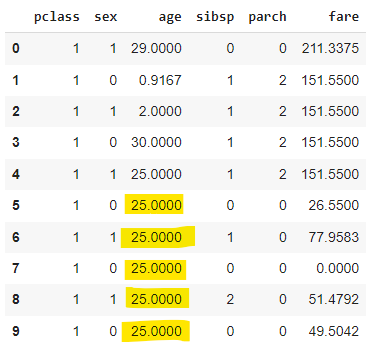
Last Observation Carried Forward (Image by Author)
7. Next Observation Carried Backward (NOCB): This method uses the next available observation to fill in the missing values for previous time points.
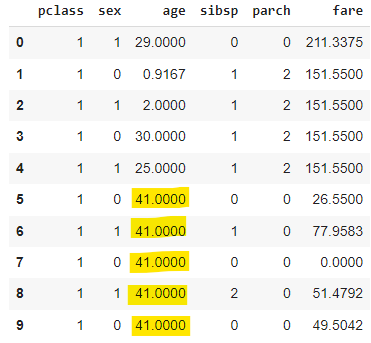
Next Observation Carried Backward (Image by Author)
8. NaNImputer: NaNImputer imputes all missing values in a pandas data frame using xgboost models. The xgboost models are trained in multiprocessing, hence comparatively fast to impute the values
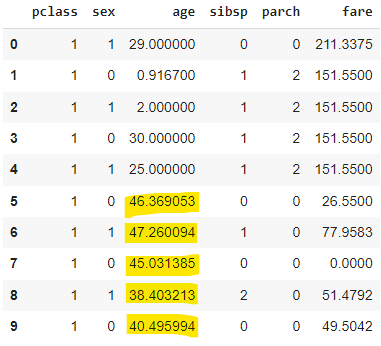
NaNImputer (Image by Author)
9. Multiple Imputed Chained Equations (MICE): This method uses chained equations to impute the missing values, with each variable imputed using a separate imputation model.
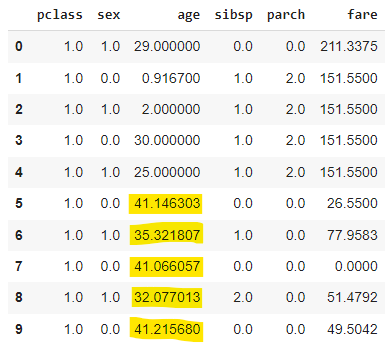
Multiple Imputed Chained Equations (Image by Author)
Result:
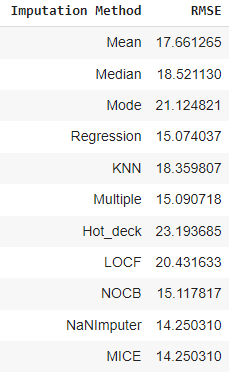
RMSE summary (Image by Author)
- Base on RMSE calculation, top 4 techniques consist of NaNImputer, MICE, Regression, Multiple.
Other:
- For the purpose of this story, I am solely presenting an example of the results obtained from an imputation method.
- Example methods that do not show in above consist of Do Nothing or Drop missing values, Cold-deck Imputation, etc.
- The choice of imputation technique depends on the type of missingness, the amount of missing data, and the nature of the data set. Different imputation techniques have different strengths and weaknesses, and no one method is perfect for all situations. By understanding the different types of missingness and imputation techniques, you can choose the most appropriate method for your data set and improve the accuracy and reliability of your analysis
Please feel free to contact me, I am willing to share and exchange on topics related to Data Science and Supply Chain.
Facebook: facebook.com/nattapong.thanngam
Linkedin: linkedin.com/in/nattapong-thanngam